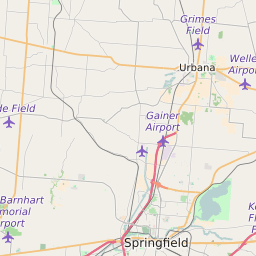
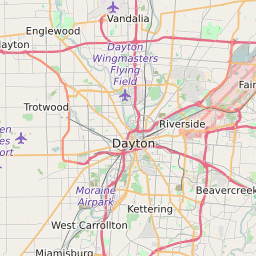
MSA Springfield, OH Map and Data
Springfield, OH Profile
| MSA Name | Springfield, OH |
| MSA Type | Metropolitan Statistical Area |
| Timezone | Eastern Daylight Time (EDT) |
| Population (2022) | 138,278 |
| Population Growth Rate (2010-19) | -3.1% |
| Majority Ethnicity | White: 87.77% |
| Median Household Income | $48,502 |
| Current Unemployment Rate | 5.8% |
Springfield, OH Race/Ethnicity Data
| Race/Ethnicity | Percentage of Population (2018) |
|---|---|
| White | 87.77% |
| African American | 7.96% |
| Hispanic | 3.38% |
| Asian | 0.63% |
| Native American | 0.19% |
| Hawaiin/Pacific Islander | 0.07% |
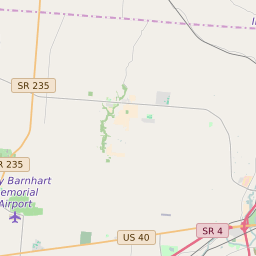
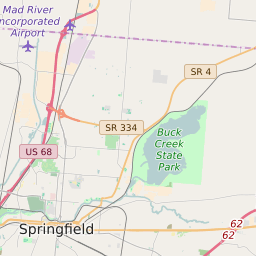
List of Counties in MSA Springfield, OH
| Clark County |