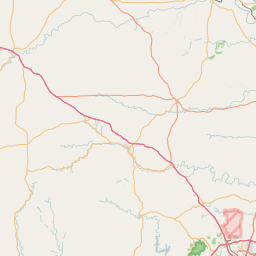
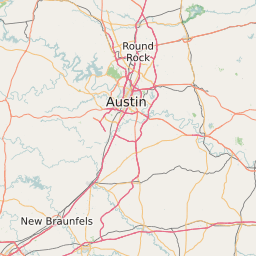
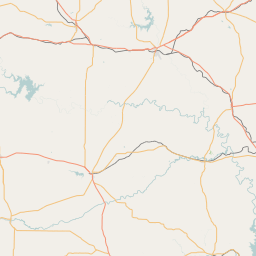
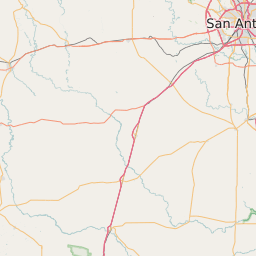
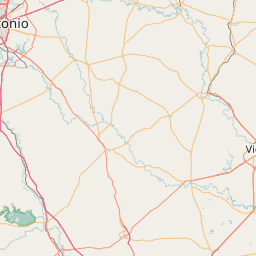
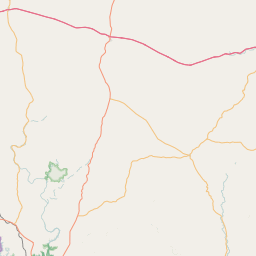
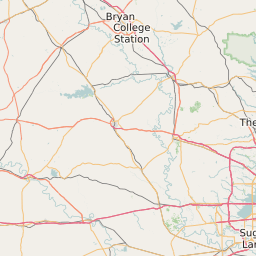
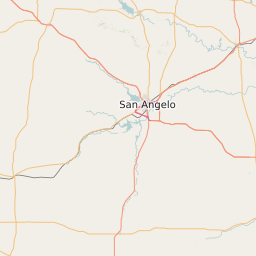
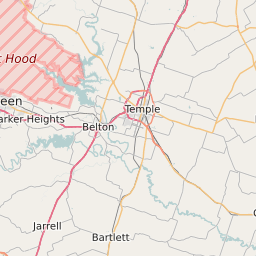
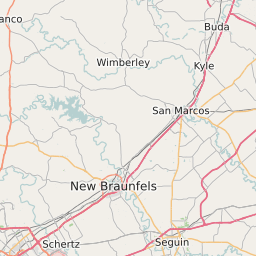
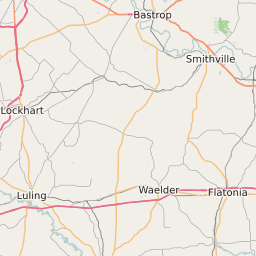
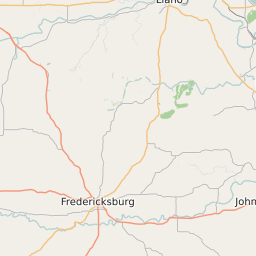
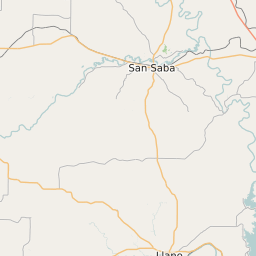
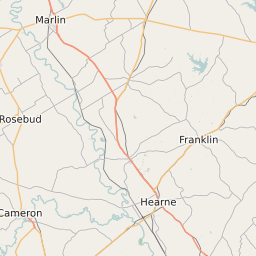
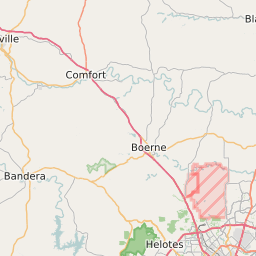
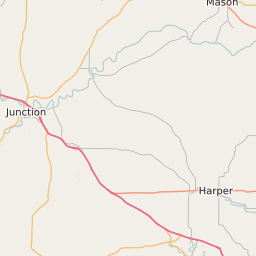
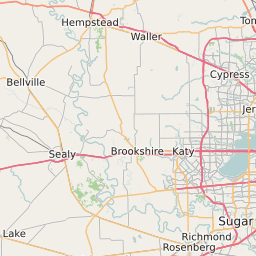
Metro Austin Unemployment Level Heat Map - February 2025
| Over 15% | 10-15% | 8-10% | 6-8% | 4-6% | 2-4% | 0-2% |
click on the map for more data:


Unemployment Rates for Selected Locations in Metro Austin | ||||||
|---|---|---|---|---|---|---|
| Place Name | Current Rate | Previous Month Rate | 6 Months Ago | 1 Year Ago | ||
|
2.90% | 3.30% | 3.40% | 3.30% | ||
|
3.10% | 3.60% | 3.90% | 3.40% | ||
|
2.50% | 2.90% | 2.90% | 3.00% | ||
|
2.80% | 3.20% | 3.20% | 3.30% | ||
|
3.40% | 3.90% | 4.20% | 3.70% | ||
|
2.80% | 3.30% | 3.40% | 3.30% | ||
|
2.90% | 3.50% | 3.50% | 3.40% | ||
|
3.80% | 4.40% | 4.50% | 4.40% | ||
|
2.30% | 2.80% | 2.80% | 2.60% | ||
|
3.10% | 3.50% | 3.60% | 3.40% | ||
|
2.90% | 3.20% | 3.30% | 3.20% | ||
|
3.50% | 4.00% | 3.80% | 3.80% | ||
|
3.00% | 3.50% | 3.50% | 3.40% | ||
|
3.10% | 3.70% | 3.60% | 3.70% | ||
|
3.40% | 4.10% | 4.30% | 4.00% | ||
|
3.30% | 3.80% | 3.90% | 3.50% | ||
|
2.90% | 3.40% | 3.40% | 3.20% | ||
|
3.40% | 3.90% | 4.10% | 3.80% | ||
|
3.00% | 3.40% | 3.50% | 3.40% | ||
|
3.30% | 3.70% | 3.70% | 3.60% | ||