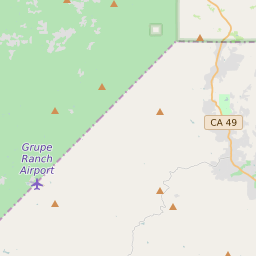
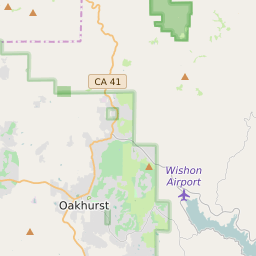
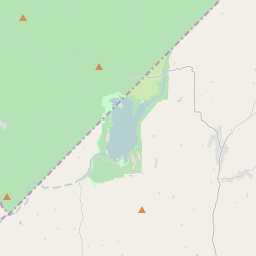
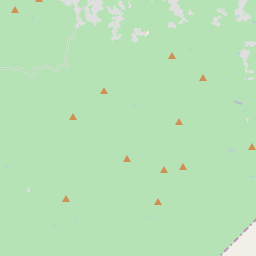
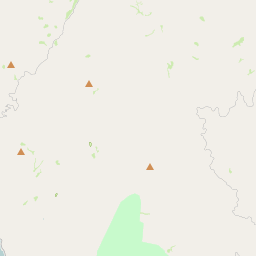
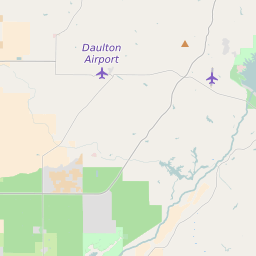
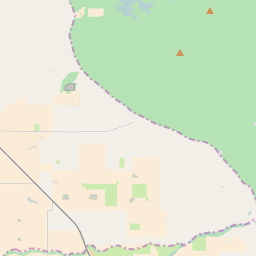
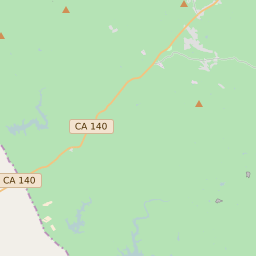
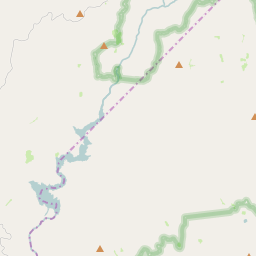
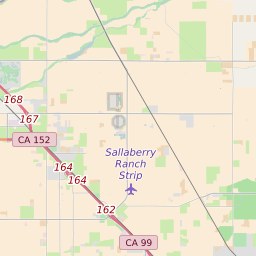
Map of Madera County Precinct Level Results for the 2020 Presidential Election
D 80-100% |
D 70-80% |
D 60-70% |
D 45-60% |
R 45-60% |
R 60-70% |
R 70-80% |
R 80-100% |


List of Madera County Precinct Level Results for the 2020 Presidential Election | ||||||||
|---|---|---|---|---|---|---|---|---|
| Map Index | Precinct | City/Town | ZIP Code | Joe Biden Democrat | Donald Trump Republican | Jo Jorgensen Libertarian | ||
| 1002 | La Vina | 93636 | 244 (50.31%) | 237 (48.87%) | 4 (0.82%) | |||
| 1004 | 93637 | 61 (39.1%) | 95 (60.9%) | 0 (0%) | ||||
| 1307 | 93622 | 110 (36.3%) | 193 (63.7%) | 0 (0%) | ||||
| 1308 | Bonadelle Ranchos | 93636 | 68 (31.48%) | 146 (67.59%) | 2 (0.93%) | |||
| 1309 | Bonadelle Ranchos | 93638 | 606 (39.07%) | 927 (59.77%) | 18 (1.16%) | |||
| 1311 | 93638 | 15 (57.69%) | 11 (42.31%) | 0 (0%) | ||||
| 1312 | 93638 | 51 (45.13%) | 62 (54.87%) | 0 (0%) | ||||
| 1315 | Madera | 93638 | 10 (34.48%) | 18 (62.07%) | 1 (3.45%) | |||
| 1316 | Madera | 93638 | 354 (75.8%) | 110 (23.55%) | 3 (0.64%) | |||
| 1317 | 93638 | 242 (66.67%) | 121 (33.33%) | 0 (0%) | ||||
| 1318 | Madera | 93638 | 611 (73.7%) | 213 (25.69%) | 5 (0.6%) | |||
| 1502 | Bonadelle Ranchos | 93636 | 573 (28.71%) | 1389 (69.59%) | 34 (1.7%) | |||
| 1505 | 93636 | 50 (31.25%) | 105 (65.63%) | 5 (3.13%) | ||||
| 1509 | Bonadelle Ranchos | 93636 | 1036 (30.46%) | 2328 (68.45%) | 37 (1.09%) | |||
| 1515 | Rolling Hills (Madera County) | 93636 | 587 (37.41%) | 954 (60.8%) | 28 (1.78%) | |||
| 2001 | 93637 | 129 (25.24%) | 377 (73.78%) | 5 (0.98%) | ||||
| 2003 | Chowchilla | 93637 | 263 (54.56%) | 217 (45.02%) | 2 (0.41%) | |||
| 2012 | Madera Acres | 93610 | 1679 (49.96%) | 1648 (49.03%) | 34 (1.01%) | |||
| 2104 | Chowchilla | 93610 | 164 (33%) | 327 (65.79%) | 6 (1.21%) | |||
| 2105 | Chowchilla | 93610 | 199 (46.39%) | 228 (53.15%) | 2 (0.47%) | |||
| 2106 | Chowchilla | 93610 | 576 (40.39%) | 833 (58.42%) | 17 (1.19%) | |||
| 2108 | Chowchilla | 93610 | 307 (41.88%) | 415 (56.62%) | 11 (1.5%) | |||
| 2109 | Chowchilla | 93610 | 416 (32.45%) | 852 (66.46%) | 14 (1.09%) | |||
| 215 | Auberry | 93664 | 1009 (23.67%) | 3207 (75.23%) | 47 (1.1%) | |||
| 216 | Big Creek | 93526 | 513 (26.79%) | 1378 (71.96%) | 24 (1.25%) | |||
| 2306 | 93610 | 162 (30.06%) | 365 (67.72%) | 12 (2.23%) | ||||
| 2309 | 93610 | 86 (21.29%) | 312 (77.23%) | 6 (1.49%) | ||||
| 3200 | Madera | 93637 | 509 (62.61%) | 297 (36.53%) | 7 (0.86%) | |||
| 3202 | Madera | 93637 | 324 (53.64%) | 269 (44.54%) | 11 (1.82%) | |||
| 3203 | Madera | 93637 | 264 (62.56%) | 156 (36.97%) | 2 (0.47%) | |||
| 3207 | Madera | 93637 | 316 (44.01%) | 397 (55.29%) | 5 (0.7%) | |||
| 3208 | Madera | 93637 | 397 (49.19%) | 398 (49.32%) | 12 (1.49%) | |||
| 3210 | Madera | 93637 | 877 (48.51%) | 918 (50.77%) | 13 (0.72%) | |||
| 3211 | Madera | 93637 | 581 (46.97%) | 641 (51.82%) | 15 (1.21%) | |||
| 3212 | Madera | 93637 | 479 (43.47%) | 608 (55.17%) | 15 (1.36%) | |||
| 3213 | Madera | 93637 | 492 (62.04%) | 292 (36.82%) | 9 (1.13%) | |||
| 3214 | Madera | 93637 | 656 (56.55%) | 494 (42.59%) | 10 (0.86%) | |||
| 3215 | Madera | 93637 | 513 (53.27%) | 446 (46.31%) | 4 (0.42%) | |||
| 3216 | 93637 | 9 (13.85%) | 56 (86.15%) | 0 (0%) | ||||
| 3217 | 93637 | 16 (51.61%) | 15 (48.39%) | 0 (0%) | ||||
| 3218 | Madera | 93637 | 38 (65.52%) | 16 (27.59%) | 4 (6.9%) | |||
| 3219 | Madera | 93637 | 15 (68.18%) | 7 (31.82%) | 0 (0%) | |||
| 4200 | Parkwood | 93637 | 335 (65.82%) | 173 (33.99%) | 1 (0.2%) | |||
| 4201 | Madera | 93637 | 271 (68.09%) | 124 (31.16%) | 3 (0.75%) | |||
| 4202 | Madera | 93638 | 962 (70.42%) | 392 (28.7%) | 12 (0.88%) | |||
| 4203 | Madera | 93638 | 441 (72.41%) | 158 (25.94%) | 10 (1.64%) | |||
| 4204 | Madera | 93638 | 157 (56.27%) | 121 (43.37%) | 1 (0.36%) | |||
| 4205 | Madera | 93638 | 573 (71.63%) | 225 (28.13%) | 2 (0.25%) | |||
| 4207 | Madera | 93638 | 324 (77.88%) | 90 (21.63%) | 2 (0.48%) | |||
| 4208 | Madera | 93638 | 177 (70.8%) | 70 (28%) | 3 (1.2%) | |||
| 4310 | Parksdale | 93638 | 344 (64.78%) | 182 (34.27%) | 5 (0.94%) | |||
| 4311 | 93638 | 10 (71.43%) | 4 (28.57%) | 0 (0%) | ||||
| 4312 | 93638 | 2 (66.67%) | 1 (33.33%) | 0 (0%) | ||||
| 5400 | Nipinnawasee | 93653 | 607 (32.37%) | 1248 (66.56%) | 20 (1.07%) | |||
| 5403 | Bass Lake | 93643 | 185 (33.51%) | 360 (65.22%) | 7 (1.27%) | |||
| 5404 | North Fork | 93626 | 677 (38.36%) | 1057 (59.89%) | 31 (1.76%) | |||
| 5409 | Oakhurst | 93601 | 1539 (36.71%) | 2586 (61.69%) | 67 (1.6%) | |||
| 5418 | Yosemite Lakes | 93645 | 1178 (32.12%) | 2452 (66.87%) | 37 (1.01%) | |||
| 5424 | North Fork | 93626 | 9 (14.52%) | 53 (85.48%) | 0 (0%) | |||
| 5425 | Yosemite Lakes | 93614 | 963 (36.23%) | 1641 (61.74%) | 54 (2.03%) | |||
| 5429 | Yosemite Lakes | 93645 | 159 (25.36%) | 458 (73.05%) | 10 (1.59%) | |||
| 5430 | Yosemite Lakes | 93601 | 157 (24.38%) | 484 (75.16%) | 3 (0.47%) | |||
| 5431 | 93653 | 1 (25%) | 3 (75%) | 0 (0%) | ||||
| 5432 | 93610 | 7 (77.78%) | 2 (22.22%) | 0 (0%) | ||||