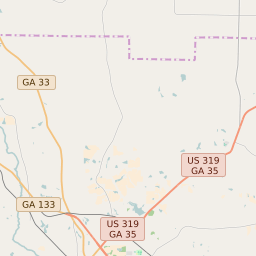
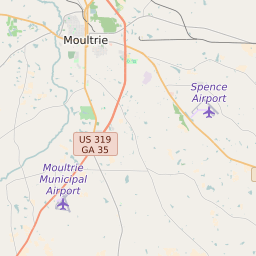
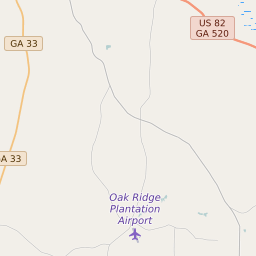
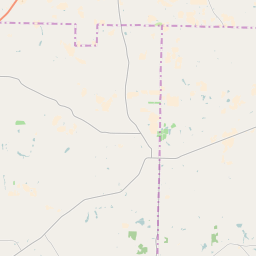
Map of Colquitt County Precinct Level Results for the 2020 Presidential Election
D 80-100% |
D 70-80% |
D 60-70% |
D 45-60% |
R 45-60% |
R 60-70% |
R 70-80% |
R 80-100% |
List of Colquitt County Precinct Level Results for the 2020 Presidential Election | ||||||||
|---|---|---|---|---|---|---|---|---|
| Map Index | Precinct | City/Town | ZIP Code | Joe Biden Democrat | Donald Trump Republican | Jo Jorgensen Libertarian | ||
| AUTREYVILLE | 31788 | 202 (21.13%) | 746 (78.03%) | 8 (0.84%) | ||||
| BRIDGECREEK | Moultrie | 31756 | 99 (11.05%) | 795 (88.73%) | 2 (0.22%) | |||
| CROSLAND | 31775 | 51 (27.13%) | 137 (72.87%) | 0 (0%) | ||||
| DOERUN | Doerun | 31744 | 140 (32.04%) | 294 (67.28%) | 3 (0.69%) | |||
| FUNSTON | Funston | 31756 | 107 (14.66%) | 613 (83.97%) | 10 (1.37%) | |||
| HAMILTON | 31738 | 55 (9.63%) | 512 (89.67%) | 4 (0.7%) | ||||
| HARTSFIELD | 31744 | 27 (8.44%) | 291 (90.94%) | 2 (0.63%) | ||||
| HOPEWELL | 31788 | 187 (15.96%) | 971 (82.85%) | 14 (1.19%) | ||||
| LEE | Moultrie | 31788 | 108 (16.14%) | 558 (83.41%) | 3 (0.45%) | |||
| MILLCREEK | 31744 | 27 (8.71%) | 281 (90.65%) | 2 (0.65%) | ||||
| MONK | Moultrie | 31771 | 170 (15.98%) | 888 (83.46%) | 6 (0.56%) | |||
| MOULTRIE | Moultrie | 31788 | 1169 (39.02%) | 1799 (60.05%) | 28 (0.93%) | |||
| MURPHY | Moultrie | 31788 | 96 (12.34%) | 676 (86.89%) | 6 (0.77%) | |||
| NORMAN PARK | Norman Park | 31768 | 372 (23.06%) | 1226 (76.01%) | 15 (0.93%) | |||
| ROBINSON | Berlin | 31778 | 93 (16.15%) | 480 (83.33%) | 3 (0.52%) | |||
| SHAW | Moultrie | 31768 | 1152 (72.45%) | 429 (26.98%) | 9 (0.57%) | |||
| THIGPEN | 31744 | 17 (9.66%) | 159 (90.34%) | 0 (0%) | ||||
| TYTY | 31771 | 31 (8.56%) | 328 (90.61%) | 3 (0.83%) | ||||
| WARRIOR | Ellenton | 31747 | 84 (12.37%) | 594 (87.48%) | 1 (0.15%) | |||


