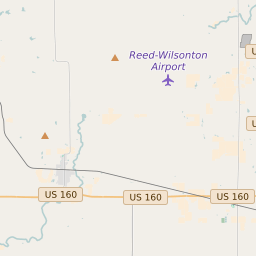
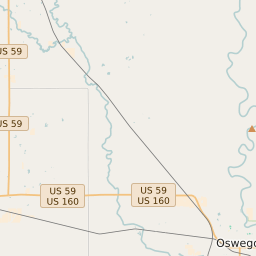
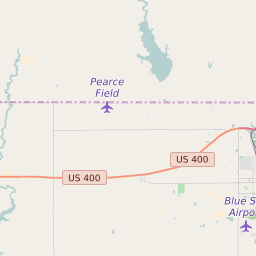
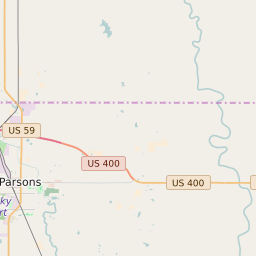
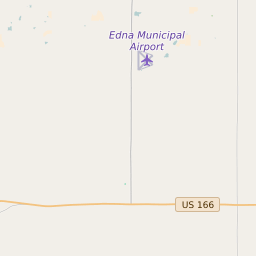
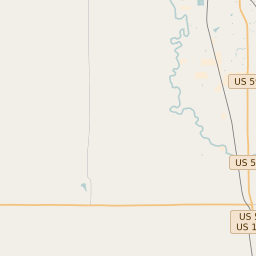
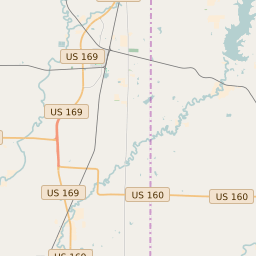
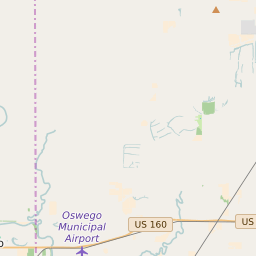
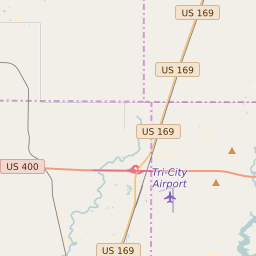
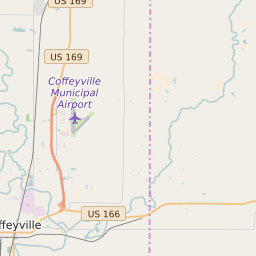
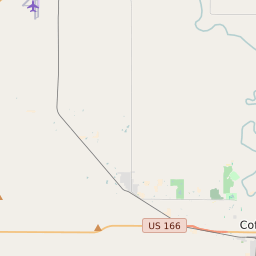
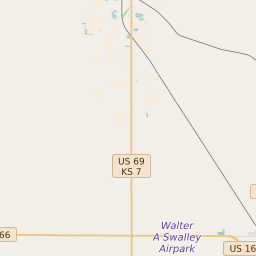
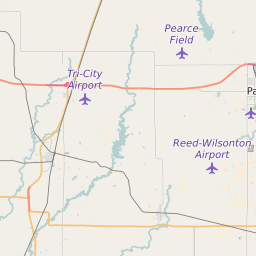
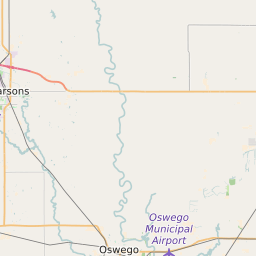
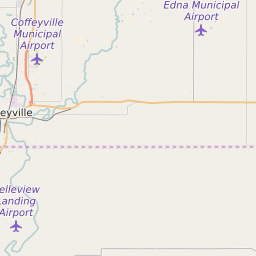
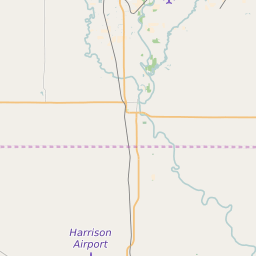
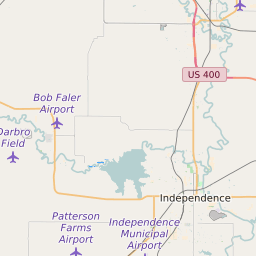
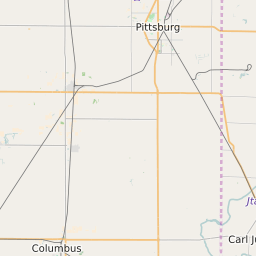
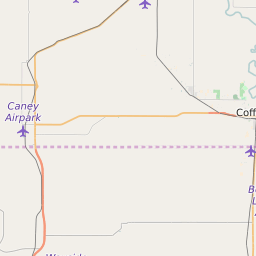
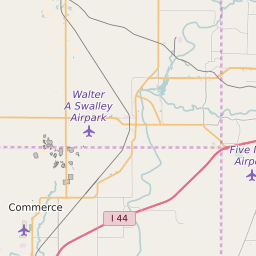
Map of Labette County Precinct Level Results for the 2020 Presidential Election
D 80-100% |
D 70-80% |
D 60-70% |
D 45-60% |
R 45-60% |
R 60-70% |
R 70-80% |
R 80-100% |
List of Labette County Precinct Level Results for the 2020 Presidential Election | ||||||||
|---|---|---|---|---|---|---|---|---|
| Map Index | Precinct | City/Town | ZIP Code | Joe Biden Democrat | Donald Trump Republican | Jo Jorgensen Libertarian | ||
| Canada Township Voting District | 67330 | 14 (12.39%) | 96 (84.96%) | 3 (2.65%) | ||||
| Chetopa Ward 1 | Chetopa | 67336 | 38 (29.69%) | 89 (69.53%) | 1 (0.78%) | |||
| Chetopa Ward 2 | Chetopa | 67336 | 26 (20.31%) | 101 (78.91%) | 1 (0.78%) | |||
| Chetopa Ward 3 | Chetopa | 67336 | 33 (20%) | 129 (78.18%) | 3 (1.82%) | |||
| Elm Grove Township Voting District | Edna | 67330 | 51 (13.21%) | 327 (84.72%) | 8 (2.07%) | |||
| Fairview Township Voting District | Altamont | 67330 | 12 (11.76%) | 90 (88.24%) | 0 (0%) | |||
| Hackberry Township Voting District | Bartlett | 67356 | 22 (11.83%) | 164 (88.17%) | 0 (0%) | |||
| Howard Township Voting District | 67342 | 27 (14.75%) | 152 (83.06%) | 4 (2.19%) | ||||
| Labette Township Voting District | 67330 | 36 (17.22%) | 170 (81.34%) | 3 (1.44%) | ||||
| Liberty Township Voting District | Labette | 67330 | 54 (24.11%) | 169 (75.45%) | 1 (0.45%) | |||
| Montana Township Voting District | 67356 | 14 (17.5%) | 66 (82.5%) | 0 (0%) | ||||
| Mound Valley Township Voting District | Mound Valley | 67335 | 46 (12.78%) | 313 (86.94%) | 1 (0.28%) | |||
| Mount Pleasant Township Voting District | Altamont | 67342 | 141 (22.14%) | 474 (74.41%) | 22 (3.45%) | |||
| Neosho Township Voting District | 67357 | 21 (25.3%) | 61 (73.49%) | 1 (1.2%) | ||||
| North Township Voting District | Parsons | 67357 | 85 (25.37%) | 238 (71.04%) | 12 (3.58%) | |||
| Osage Township Voting District | Dennis | 66776 | 68 (20.8%) | 247 (75.54%) | 12 (3.67%) | |||
| Oswego City Ward 1 | Oswego | 67356 | 65 (23.9%) | 201 (73.9%) | 6 (2.21%) | |||
| Oswego City Ward 2 | Oswego | 67356 | 65 (24.34%) | 195 (73.03%) | 7 (2.62%) | |||
| Oswego City Ward 3 | Oswego | 67356 | 54 (26.6%) | 145 (71.43%) | 4 (1.97%) | |||
| Oswego Township Voting District | 67356 | 26 (18.18%) | 114 (79.72%) | 3 (2.1%) | ||||
| Parsons Ward 1 Precinct 1 | Parsons | 67357 | 149 (45.15%) | 173 (52.42%) | 8 (2.42%) | |||
| Parsons Ward 1 Precinct 2 | Parsons | 67357 | 58 (36.02%) | 101 (62.73%) | 2 (1.24%) | |||
| Parsons Ward 1 Precinct 3 | Parsons | 67357 | 70 (47.62%) | 73 (49.66%) | 4 (2.72%) | |||
| Parsons Ward 2 Precinct 1 | Parsons | 67357 | 56 (53.85%) | 45 (43.27%) | 3 (2.88%) | |||
| Parsons Ward 2 Precinct 2 | Parsons | 67357 | 147 (57.2%) | 102 (39.69%) | 8 (3.11%) | |||
| Parsons Ward 2 Precinct 3 | Parsons | 67357 | 158 (47.88%) | 169 (51.21%) | 3 (0.91%) | |||
| Parsons Ward 3 Precinct 1 | Parsons | 67357 | 62 (45.26%) | 74 (54.01%) | 1 (0.73%) | |||
| Parsons Ward 3 Precinct 2 | Parsons | 67357 | 180 (46.15%) | 202 (51.79%) | 8 (2.05%) | |||
| Parsons Ward 3 Precinct 3 | Parsons | 67357 | 143 (45.69%) | 162 (51.76%) | 8 (2.56%) | |||
| Parsons Ward 3 Precinct 4 | Parsons | 67357 | 193 (43.67%) | 237 (53.62%) | 12 (2.71%) | |||
| Parsons Ward 4 Precinct 1 | Parsons | 67357 | 57 (37.75%) | 91 (60.26%) | 3 (1.99%) | |||
| Parsons Ward 4 Precinct 2 | Parsons | 67357 | 116 (48.13%) | 121 (50.21%) | 4 (1.66%) | |||
| Parsons Ward 4 Precinct 3 | Parsons | 67357 | 77 (42.54%) | 95 (52.49%) | 9 (4.97%) | |||
| Parsons Ward 4 Precinct 4 | Parsons | 67357 | 135 (43.55%) | 174 (56.13%) | 1 (0.32%) | |||
| Richland Township H1 A Voting District | 67336 | 4 (12.9%) | 27 (87.1%) | 0 (0%) | ||||
| Richland Township H1 Voting District | 67336 | 2 (8.7%) | 21 (91.3%) | 0 (0%) | ||||
| Richland Township H7 Voting District | 67356 | 21 (29.17%) | 51 (70.83%) | 0 (0%) | ||||
| Walton Township Voting District | 67357 | 129 (31.31%) | 276 (66.99%) | 7 (1.7%) | ||||