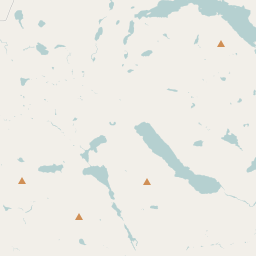
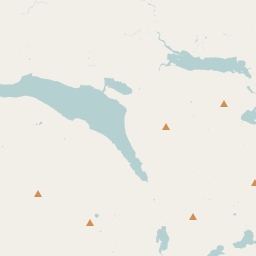
Map of Piscataquis County Precinct Level Results for the 2020 Presidential Election
D 80-100% |
D 70-80% |
D 60-70% |
D 45-60% |
R 45-60% |
R 60-70% |
R 70-80% |
R 80-100% |
List of Piscataquis County Precinct Level Results for the 2020 Presidential Election | ||||||||
|---|---|---|---|---|---|---|---|---|
| Map Index | Precinct | City/Town | ZIP Code | Joe Biden Democrat | Donald Trump Republican | Jo Jorgensen Libertarian | ||
| Abbot | 04464 | 122 (29.19%) | 289 (69.14%) | 7 (1.67%) | ||||
| Atkinson | 04463 | 50 (28.9%) | 122 (70.52%) | 1 (0.58%) | ||||
| Beaver Cove/Frenchtown/Lily Bay | 04441 | 60 (50%) | 60 (50%) | 0 (0%) | ||||
| Bowerbank | 04481 | 41 (35.04%) | 76 (64.96%) | 0 (0%) | ||||
| Brownville/Barnard/Ebeemee/Williamsburg/T4 R9 | Brownville Junction | 04415 | 283 (36.38%) | 468 (60.15%) | 27 (3.47%) | |||
| Dover-Foxcroft | Dover-Foxcroft | 04481 | 924 (39.69%) | 1359 (58.38%) | 45 (1.93%) | |||
| Greenville/Unorganized Twps | Greenville | 04406 | 491 (42.55%) | 646 (55.98%) | 17 (1.47%) | |||
| Guilford/Kingsbury | Guilford | 04464 | 251 (34.62%) | 467 (64.41%) | 7 (0.97%) | |||
| Lake View | 04414 | 40 (35.09%) | 71 (62.28%) | 3 (2.63%) | ||||
| Medford | 04463 | 47 (29.01%) | 112 (69.14%) | 3 (1.85%) | ||||
| Millinocket Piscataquis | 04462 | 26 (29.89%) | 61 (70.11%) | 0 (0%) | ||||
| Milo/Orneville | Milo | 04414 | 414 (33.88%) | 783 (64.08%) | 25 (2.05%) | |||
| Monson/Blanchard/Elliottsville | 04920 | 175 (36.92%) | 290 (61.18%) | 9 (1.9%) | ||||
| Parkman | 04479 | 150 (30.61%) | 334 (68.16%) | 6 (1.22%) | ||||
| Sangerville | 04443 | 258 (34.22%) | 480 (63.66%) | 16 (2.12%) | ||||
| Sebec | 04426 | 118 (27.57%) | 306 (71.5%) | 4 (0.93%) | ||||
| Shirley | 04442 | 34 (25.56%) | 96 (72.18%) | 3 (2.26%) | ||||
| Wellington | 04923 | 51 (42.86%) | 67 (56.3%) | 1 (0.84%) | ||||
| Willimantic | 04464 | 20 (22.22%) | 70 (77.78%) | 0 (0%) | ||||


