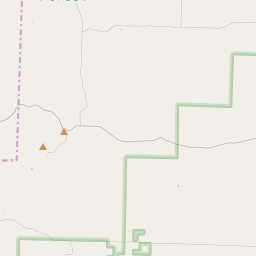
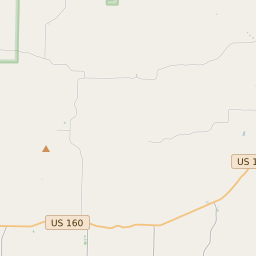
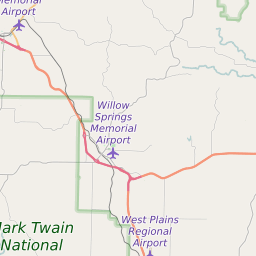
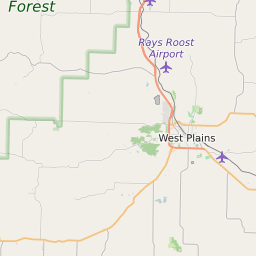
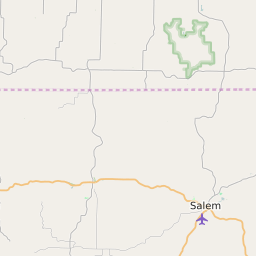
Map of Howell County Precinct Level Results for the 2020 Presidential Election
D 80-100% |
D 70-80% |
D 60-70% |
D 45-60% |
R 45-60% |
R 60-70% |
R 70-80% |
R 80-100% |
List of Howell County Precinct Level Results for the 2020 Presidential Election | ||||||||
|---|---|---|---|---|---|---|---|---|
| Map Index | Precinct | City/Town | ZIP Code | Joe Biden Democrat | Donald Trump Republican | Jo Jorgensen Libertarian | ||
| Benton 1 | 65775 | 25 (7.79%) | 294 (91.59%) | 2 (0.62%) | ||||
| Benton 2 | South Fork | 65790 | 89 (12.06%) | 643 (87.13%) | 6 (0.81%) | |||
| Chapel | 65789 | 42 (12.73%) | 285 (86.36%) | 3 (0.91%) | ||||
| Dry Creek | West Plains | 65793 | 116 (12.92%) | 781 (86.97%) | 1 (0.11%) | |||
| Goldsberry | Mountain View | 65548 | 310 (17.29%) | 1466 (81.76%) | 17 (0.95%) | |||
| Howell 1 | West Plains | 65775 | 434 (24.87%) | 1288 (73.81%) | 23 (1.32%) | |||
| Howell 2 | West Plains | 65775 | 299 (23.58%) | 948 (74.76%) | 21 (1.66%) | |||
| Howell 3 | West Plains | 65775 | 220 (26.83%) | 586 (71.46%) | 14 (1.71%) | |||
| Howell 4 | West Plains | 65775 | 232 (25.52%) | 655 (72.06%) | 22 (2.42%) | |||
| Howell 5 | 65789 | 345 (13.54%) | 2182 (85.64%) | 21 (0.82%) | ||||
| Howell 6 | 65788 | 141 (13.57%) | 888 (85.47%) | 10 (0.96%) | ||||
| Hutton Valley | Willow Springs | 65789 | 90 (13.72%) | 562 (85.67%) | 4 (0.61%) | |||
| Myatt 1 | 65775 | 28 (10.73%) | 232 (88.89%) | 1 (0.38%) | ||||
| Myatt 2/Howell 7 | Brandsville | 65688 | 68 (16.15%) | 348 (82.66%) | 5 (1.19%) | |||
| Siloam Springs | 65789 | 39 (15.23%) | 215 (83.98%) | 2 (0.78%) | ||||
| Sisson | 65789 | 97 (13.38%) | 620 (85.52%) | 8 (1.1%) | ||||
| South Fork | 65777 | 97 (17.96%) | 437 (80.93%) | 6 (1.11%) | ||||
| Spring Creek | 65626 | 140 (14.69%) | 804 (84.37%) | 9 (0.94%) | ||||
| Willow Springs 1 | Willow Springs | 65793 | 241 (19.48%) | 987 (79.79%) | 9 (0.73%) | |||
| Willow Springs 2 | Willow Springs | 65789 | 165 (14.5%) | 960 (84.36%) | 13 (1.14%) | |||
