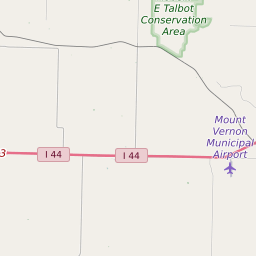
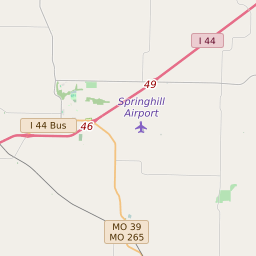
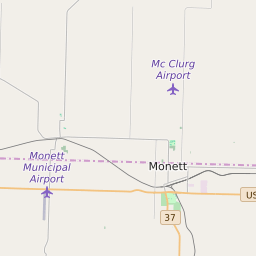
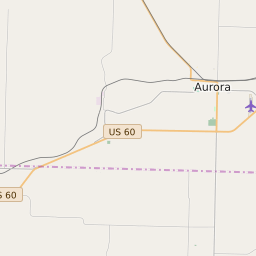
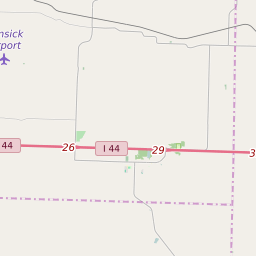
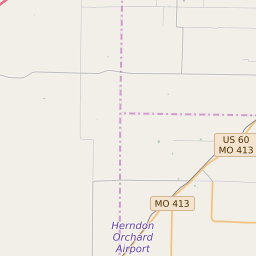
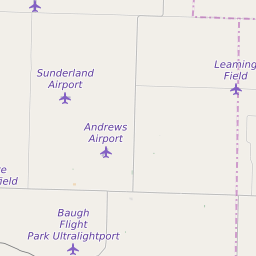
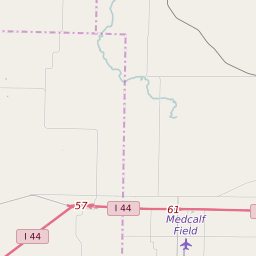
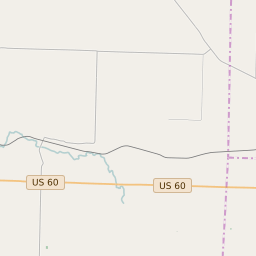
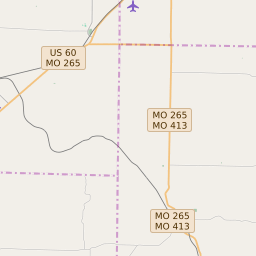
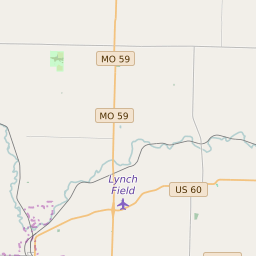
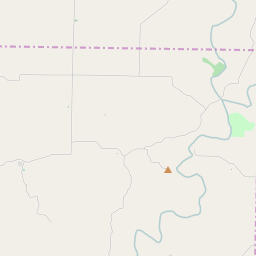
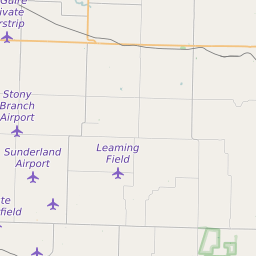
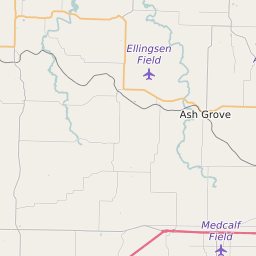
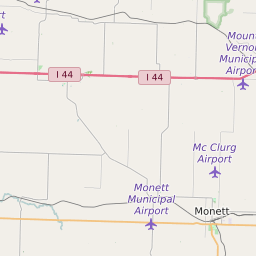
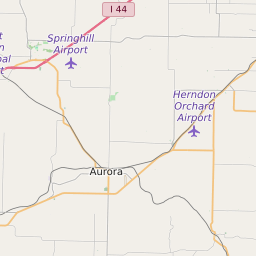
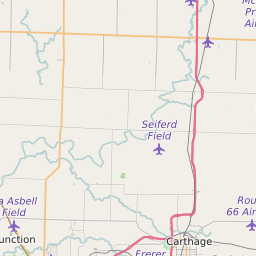
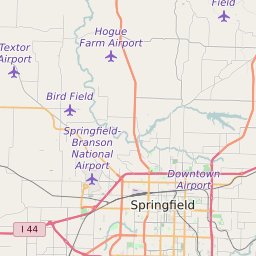
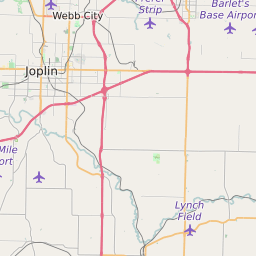
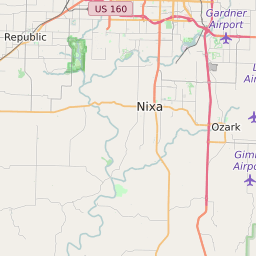
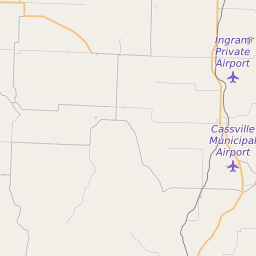
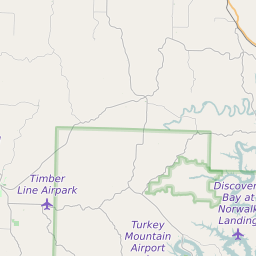
Map of Lawrence County Precinct Level Results for the 2020 Presidential Election
D 80-100% |
D 70-80% |
D 60-70% |
D 45-60% |
R 45-60% |
R 60-70% |
R 70-80% |
R 80-100% |

List of Lawrence County Precinct Level Results for the 2020 Presidential Election | ||||||||
|---|---|---|---|---|---|---|---|---|
| Map Index | Precinct | City/Town | ZIP Code | Joe Biden Democrat | Donald Trump Republican | Jo Jorgensen Libertarian | ||
| Aurora North | Aurora | 65769 | 153 (15.6%) | 820 (83.59%) | 8 (0.82%) | |||
| Aurora Southeast | Aurora | 65605 | 218 (16.69%) | 1068 (81.78%) | 20 (1.53%) | |||
| Aurora Southwest | Aurora | 65605 | 292 (18.97%) | 1229 (79.86%) | 18 (1.17%) | |||
| Buck Prairie | Marionville | 65610 | 330 (16.55%) | 1640 (82.25%) | 24 (1.2%) | |||
| Forest Park | Monett | 65708 | 486 (26.76%) | 1311 (72.19%) | 19 (1.05%) | |||
| Freistatt | Freistatt | 65769 | 68 (20.06%) | 271 (79.94%) | 0 (0%) | |||
| Green | 64848 | 39 (14.66%) | 225 (84.59%) | 2 (0.75%) | ||||
| Hoberg | Hoberg | 65756 | 56 (15.86%) | 293 (83%) | 4 (1.13%) | |||
| Lincoln | Miller | 65712 | 152 (16.85%) | 742 (82.26%) | 8 (0.89%) | |||
| Mt. Pleasant | 65756 | 60 (11.32%) | 469 (88.49%) | 1 (0.19%) | ||||
| Mt. Vernon North | Mount Vernon | 64848 | 186 (14.66%) | 1067 (84.08%) | 16 (1.26%) | |||
| Mt. Vernon Southeast | Mount Vernon | 65605 | 220 (19.1%) | 919 (79.77%) | 13 (1.13%) | |||
| Mt. Vernon Southwest | Mount Vernon | 65712 | 196 (18.39%) | 850 (79.74%) | 20 (1.88%) | |||
| Ozark | Halltown | 65612 | 124 (14.49%) | 726 (84.81%) | 6 (0.7%) | |||
| Pierce City | Pierce City | 64873 | 207 (18.14%) | 918 (80.46%) | 16 (1.4%) | |||
| Red Oak | 64862 | 24 (12%) | 170 (85%) | 6 (3%) | ||||
| Spring River | Verona | 65605 | 203 (24.14%) | 631 (75.03%) | 7 (0.83%) | |||
| Turnback | Chesapeake | 65605 | 118 (14.34%) | 693 (84.2%) | 12 (1.46%) | |||
| Vineyard | Stotts City | 65712 | 82 (17.52%) | 384 (82.05%) | 2 (0.43%) | |||