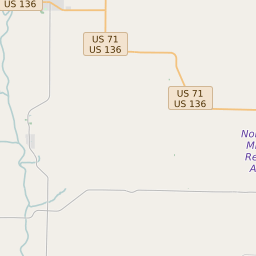
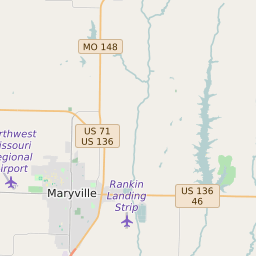
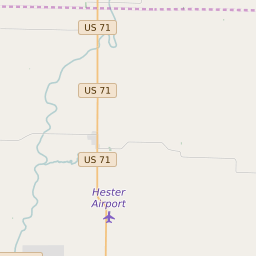
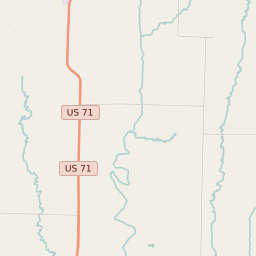
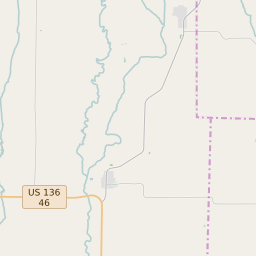
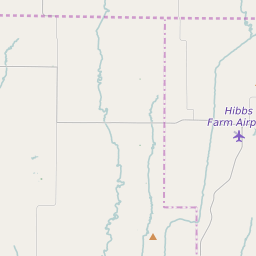
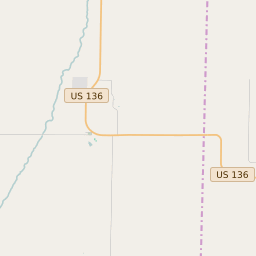
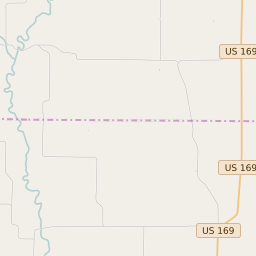
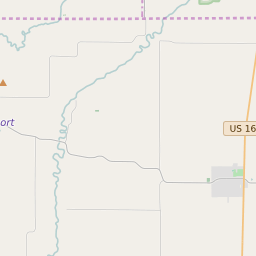
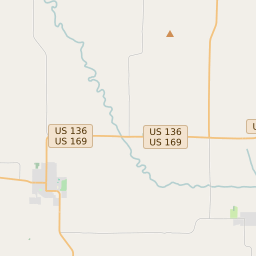
Map of Nodaway County Precinct Level Results for the 2020 Presidential Election
D 80-100% |
D 70-80% |
D 60-70% |
D 45-60% |
R 45-60% |
R 60-70% |
R 70-80% |
R 80-100% |


List of Nodaway County Precinct Level Results for the 2020 Presidential Election | ||||||||
|---|---|---|---|---|---|---|---|---|
| Map Index | Precinct | City/Town | ZIP Code | Joe Biden Democrat | Donald Trump Republican | Jo Jorgensen Libertarian | ||
| Atchison | Clearmont | 64428 | 54 (21.43%) | 197 (78.17%) | 1 (0.4%) | |||
| Grant | Barnard | 64434 | 105 (27.85%) | 272 (72.15%) | 0 (0%) | |||
| Green | Quitman | 64468 | 27 (17.65%) | 126 (82.35%) | 0 (0%) | |||
| Hopkins | Hopkins | 64431 | 63 (17.5%) | 297 (82.5%) | 0 (0%) | |||
| Hughes | Graham | 64423 | 30 (10.34%) | 251 (86.55%) | 9 (3.1%) | |||
| Independence | Parnell | 64461 | 40 (21.74%) | 143 (77.72%) | 1 (0.54%) | |||
| Jackson | Ravenwood | 64468 | 95 (16.73%) | 470 (82.75%) | 3 (0.53%) | |||
| Jefferson | Clyde | 64433 | 105 (24.65%) | 318 (74.65%) | 3 (0.7%) | |||
| Lincoln | Elmo | 64431 | 37 (17.54%) | 174 (82.46%) | 0 (0%) | |||
| Monroe | Skidmore | 64468 | 60 (23.08%) | 197 (75.77%) | 3 (1.15%) | |||
| Nodaway | Burlington Junction | 64468 | 89 (19.43%) | 361 (78.82%) | 8 (1.75%) | |||
| Polk A | Maryville | 64476 | 755 (31.9%) | 1570 (66.33%) | 42 (1.77%) | |||
| Polk B | Maryville | 64468 | 1002 (43.02%) | 1274 (54.7%) | 53 (2.28%) | |||
| Polk E | Maryville | 64468 | 236 (29.84%) | 550 (69.53%) | 5 (0.63%) | |||
| Union | Pickering | 64461 | 54 (20.38%) | 210 (79.25%) | 1 (0.38%) | |||
| Washington | Guilford | 64434 | 25 (12.25%) | 179 (87.75%) | 0 (0%) | |||
| White Cloud | Arkoe | 64468 | 76 (21.47%) | 276 (77.97%) | 2 (0.56%) | |||