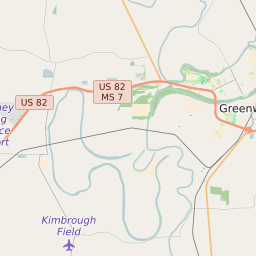
Map of Leflore County Precinct Level Results for the 2020 Presidential Election
D 80-100% |
D 70-80% |
D 60-70% |
D 45-60% |
R 45-60% |
R 60-70% |
R 70-80% |
R 80-100% |
List of Leflore County Precinct Level Results for the 2020 Presidential Election | ||||||||
|---|---|---|---|---|---|---|---|---|
| Map Index | Precinct | City/Town | ZIP Code | Joe Biden Democrat | Donald Trump Republican | Jo Jorgensen Libertarian | ||
| Central Greenwood | Greenwood | 38930 | 240 (78.18%) | 66 (21.5%) | 1 (0.33%) | |||
| East Greenwood | Greenwood | 38930 | 1110 (97.11%) | 31 (2.71%) | 2 (0.17%) | |||
| Minter City | 38930 | 80 (42.55%) | 108 (57.45%) | 0 (0%) | ||||
| Money | 38930 | 33 (25.19%) | 98 (74.81%) | 0 (0%) | ||||
| Morgan City | Morgan City | 38954 | 101 (61.59%) | 62 (37.8%) | 1 (0.61%) | |||
| MVSU | Mississippi Valley State University | 38952 | 249 (92.57%) | 19 (7.06%) | 1 (0.37%) | |||
| North Greenwood | Greenwood | 38930 | 770 (28.3%) | 1940 (71.3%) | 11 (0.4%) | |||
| North Itta Bena | Itta Bena | 38941 | 888 (91.26%) | 84 (8.63%) | 1 (0.1%) | |||
| Northeast Greenwood | 38930 | 625 (83.78%) | 116 (15.55%) | 5 (0.67%) | ||||
| Rising Sun | Greenwood | 38954 | 426 (96.38%) | 16 (3.62%) | 0 (0%) | |||
| Schlater | Schlater | 38941 | 119 (52.89%) | 106 (47.11%) | 0 (0%) | |||
| Sidon | Sidon | 38924 | 167 (74.22%) | 58 (25.78%) | 0 (0%) | |||
| South Greenwood | Greenwood | 38930 | 301 (97.1%) | 8 (2.58%) | 1 (0.32%) | |||
| South Itta Bena | 38930 | 249 (80.58%) | 59 (19.09%) | 1 (0.32%) | ||||
| Southeast Greenwood | 38954 | 1054 (85.28%) | 179 (14.48%) | 3 (0.24%) | ||||
| Southwest Greenwood | Greenwood | 38930 | 339 (97.69%) | 7 (2.02%) | 1 (0.29%) | |||
| Swiftown | 38959 | 18 (43.9%) | 23 (56.1%) | 0 (0%) | ||||
| West Greenwood | Greenwood | 38952 | 879 (85.26%) | 149 (14.45%) | 3 (0.29%) | |||


