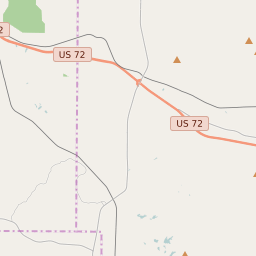
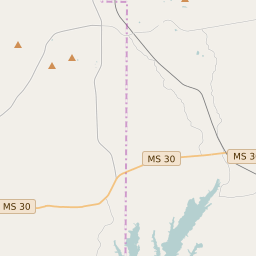
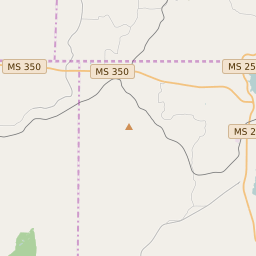
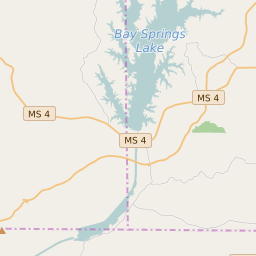
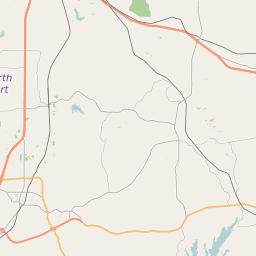
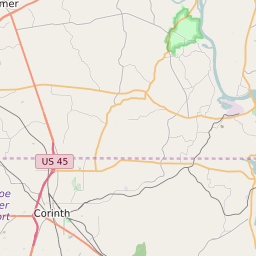
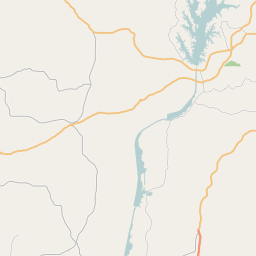
Map of Tishomingo County Precinct Level Results for the 2020 Presidential Election
D 80-100% |
D 70-80% |
D 60-70% |
D 45-60% |
R 45-60% |
R 60-70% |
R 70-80% |
R 80-100% |
List of Tishomingo County Precinct Level Results for the 2020 Presidential Election | ||||||||
|---|---|---|---|---|---|---|---|---|
| Map Index | Precinct | City/Town | ZIP Code | Joe Biden Democrat | Donald Trump Republican | Jo Jorgensen Libertarian | ||
| Belmont | Belmont | 38838 | 57 (6.31%) | 839 (92.81%) | 8 (0.88%) | |||
| Burnsville | Burnsville | 38846 | 54 (6.97%) | 709 (91.48%) | 12 (1.55%) | |||
| Coles Mill | 38833 | 58 (10.66%) | 486 (89.34%) | 0 (0%) | ||||
| Cotton Springs | 38827 | 15 (6.44%) | 218 (93.56%) | 0 (0%) | ||||
| Dennis | Dennis | 38838 | 14 (6.03%) | 216 (93.1%) | 2 (0.86%) | |||
| East Iuka | Iuka | 38852 | 201 (15.88%) | 1047 (82.7%) | 18 (1.42%) | |||
| Golden | Belmont | 38827 | 37 (6.89%) | 495 (92.18%) | 5 (0.93%) | |||
| Hubbard-Salem | 38852 | 14 (10.22%) | 123 (89.78%) | 0 (0%) | ||||
| Iuka | Iuka | 38852 | 218 (12.16%) | 1552 (86.56%) | 23 (1.28%) | |||
| North Belmont | Belmont | 38827 | 25 (8.2%) | 274 (89.84%) | 6 (1.97%) | |||
| North Burnsville | Burnsville | 38846 | 46 (8.9%) | 465 (89.94%) | 6 (1.16%) | |||
| Paden | Paden | 38873 | 31 (11.92%) | 228 (87.69%) | 1 (0.38%) | |||
| Spring Hill | 38873 | 81 (17.76%) | 370 (81.14%) | 5 (1.1%) | ||||
| Tishomingo | Paden | 38827 | 208 (18.41%) | 911 (80.62%) | 11 (0.97%) | |||
