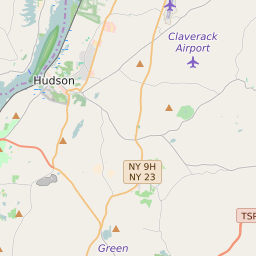
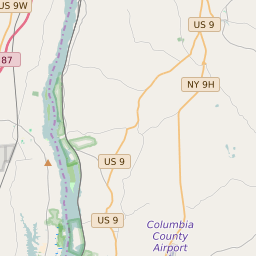
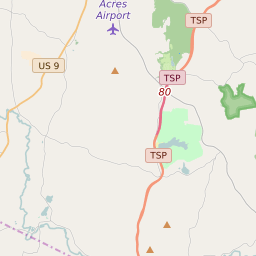
Map of Columbia County Precinct Level Results for the 2020 Presidential Election
D 80-100% |
D 70-80% |
D 60-70% |
D 45-60% |
R 45-60% |
R 60-70% |
R 70-80% |
R 80-100% |
List of Columbia County Precinct Level Results for the 2020 Presidential Election | ||||||||
|---|---|---|---|---|---|---|---|---|
| Map Index | Precinct | City/Town | ZIP Code | Joe Biden Democrat | Donald Trump Republican | Jo Jorgensen Libertarian | ||
| Ancram 1 | 12516 | 299 (57.72%) | 214 (41.31%) | 5 (0.97%) | ||||
| Ancram 2 | 12567 | 227 (53.54%) | 194 (45.75%) | 3 (0.71%) | ||||
| Austerlitz 1 | 12529 | 392 (65.22%) | 202 (33.61%) | 7 (1.16%) | ||||
| Austerlitz 2 | 12017 | 403 (70.45%) | 165 (28.85%) | 4 (0.7%) | ||||
| Canaan 1 | 12060 | 412 (70.91%) | 161 (27.71%) | 8 (1.38%) | ||||
| Canaan 2 | 12037 | 363 (65.05%) | 180 (32.26%) | 15 (2.69%) | ||||
| Chatham 1 | Chatham | 12060 | 628 (68.48%) | 277 (30.21%) | 12 (1.31%) | |||
| Chatham 2 | Chatham | 12184 | 459 (64.56%) | 247 (34.74%) | 5 (0.7%) | |||
| Chatham 3 | Niverville | 12123 | 672 (63.16%) | 381 (35.81%) | 11 (1.03%) | |||
| Claverack 1 | Claverack-Red Mills | 12534 | 282 (46.46%) | 323 (53.21%) | 2 (0.33%) | |||
| Claverack 2 | Claverack-Red Mills | 12075 | 362 (50.07%) | 349 (48.27%) | 12 (1.66%) | |||
| Claverack 3 | Philmont | 12075 | 306 (53.78%) | 253 (44.46%) | 10 (1.76%) | |||
| Claverack 4 | Philmont | 12521 | 462 (55.33%) | 358 (42.87%) | 15 (1.8%) | |||
| Claverack 5 | 12530 | 217 (49.43%) | 218 (49.66%) | 4 (0.91%) | ||||
| Clermont 1 | 12523 | 596 (53.65%) | 503 (45.27%) | 12 (1.08%) | ||||
| Copake 1 | Copake Lake | 12516 | 645 (60.17%) | 416 (38.81%) | 11 (1.03%) | |||
| Copake 2 | Copake Falls | 12502 | 496 (53.33%) | 431 (46.34%) | 3 (0.32%) | |||
| Gallatin 1 | 12571 | 517 (55.53%) | 411 (44.15%) | 3 (0.32%) | ||||
| Germantown 1 | Germantown | 12526 | 398 (57.18%) | 292 (41.95%) | 6 (0.86%) | |||
| Germantown 2 | Germantown | 12526 | 332 (61.03%) | 205 (37.68%) | 7 (1.29%) | |||
| Ghent 1 | Chatham | 12037 | 574 (63.01%) | 328 (36%) | 9 (0.99%) | |||
| Ghent 2 | Ghent | 12529 | 693 (58.38%) | 482 (40.61%) | 12 (1.01%) | |||
| Ghent 3 | 12106 | 475 (46.66%) | 531 (52.16%) | 12 (1.18%) | ||||
| Greenport 1 | 12534 | 458 (54.85%) | 364 (43.59%) | 13 (1.56%) | ||||
| Greenport 2 | 12534 | 294 (53.65%) | 251 (45.8%) | 3 (0.55%) | ||||
| Greenport 3 | Stottville | 12534 | 363 (47.39%) | 392 (51.17%) | 11 (1.44%) | |||
| Hillsdale 1 | 12075 | 471 (72.8%) | 171 (26.43%) | 5 (0.77%) | ||||
| Hillsdale 2 | 12529 | 443 (71.8%) | 170 (27.55%) | 4 (0.65%) | ||||
| Hudson 1 | Hudson | 12534 | 586 (88.12%) | 78 (11.73%) | 1 (0.15%) | |||
| Hudson 2 | Hudson | 12534 | 363 (90.52%) | 38 (9.48%) | 0 (0%) | |||
| Hudson 3 | Hudson | 12534 | 440 (80.59%) | 99 (18.13%) | 7 (1.28%) | |||
| Hudson 4 | Hudson | 12534 | 447 (82.78%) | 87 (16.11%) | 6 (1.11%) | |||
| Hudson 5 | Hudson | 12534 | 427 (69.09%) | 188 (30.42%) | 3 (0.49%) | |||
| Kinderhook 1 | Kinderhook | 12106 | 402 (65.69%) | 203 (33.17%) | 7 (1.14%) | |||
| Kinderhook 2 | Kinderhook | 12106 | 311 (65.47%) | 162 (34.11%) | 2 (0.42%) | |||
| Kinderhook 3 | Valatie | 12184 | 338 (50.9%) | 319 (48.04%) | 7 (1.05%) | |||
| Kinderhook 4 | Valatie | 12106 | 314 (49.53%) | 314 (49.53%) | 6 (0.95%) | |||
| Kinderhook 5 | 12037 | 373 (51.38%) | 346 (47.66%) | 7 (0.96%) | ||||
| Kinderhook 6 | Niverville | 12130 | 250 (43.25%) | 320 (55.36%) | 8 (1.38%) | |||
| Kinderhook 7 | Niverville | 12184 | 331 (48.46%) | 343 (50.22%) | 9 (1.32%) | |||
| Kinderhook 8 | 12184 | 355 (50.21%) | 347 (49.08%) | 5 (0.71%) | ||||
| Livingston 1 | 12526 | 517 (48.09%) | 552 (51.35%) | 6 (0.56%) | ||||
| Livingston 2 | 12583 | 367 (43.23%) | 471 (55.48%) | 11 (1.3%) | ||||
| New Lebanon 1 | 12168 | 401 (67.28%) | 185 (31.04%) | 10 (1.68%) | ||||
| New Lebanon 2 | 12024 | 327 (48.3%) | 341 (50.37%) | 9 (1.33%) | ||||
| Stockport 1 | 12173 | 261 (41.63%) | 359 (57.26%) | 7 (1.12%) | ||||
| Stockport 2 | Stottville | 12172 | 286 (44.76%) | 348 (54.46%) | 5 (0.78%) | |||
| Stuyvesant 1 | 12173 | 256 (50%) | 250 (48.83%) | 6 (1.17%) | ||||
| Stuyvesant 2 | 12106 | 333 (52.52%) | 299 (47.16%) | 2 (0.32%) | ||||
| Taghkanic 1 | Copake Lake | 12534 | 462 (56.55%) | 346 (42.35%) | 9 (1.1%) | |||


