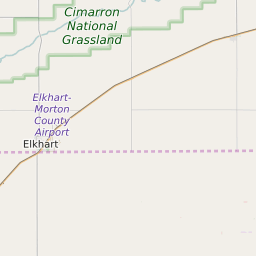
Map of Texas County Precinct Level Results for the 2020 Presidential Election
D 80-100% |
D 70-80% |
D 60-70% |
D 45-60% |
R 45-60% |
R 60-70% |
R 70-80% |
R 80-100% |
List of Texas County Precinct Level Results for the 2020 Presidential Election | ||||||||
|---|---|---|---|---|---|---|---|---|
| Map Index | Precinct | City/Town | ZIP Code | Joe Biden Democrat | Donald Trump Republican | Jo Jorgensen Libertarian | ||
| 700101 | Adams | 73901 | 73 (9.55%) | 677 (88.61%) | 14 (1.83%) | |||
| 700102 | Guymon | 73942 | 100 (31.15%) | 217 (67.6%) | 4 (1.25%) | |||
| 700104 | Tyrone | 73945 | 43 (10.83%) | 350 (88.16%) | 4 (1.01%) | |||
| 700107 | Hardesty | 73901 | 16 (9.82%) | 146 (89.57%) | 1 (0.61%) | |||
| 700201 | Guymon | 73945 | 164 (17.96%) | 731 (80.07%) | 18 (1.97%) | |||
| 700202 | Optima | 73945 | 83 (21.45%) | 299 (77.26%) | 5 (1.29%) | |||
| 700205 | Guymon | 73939 | 115 (15.54%) | 615 (83.11%) | 10 (1.35%) | |||
| 700302 | 73942 | 11 (6.71%) | 153 (93.29%) | 0 (0%) | ||||
| 700303 | Texhoma | 73939 | 42 (11.38%) | 319 (86.45%) | 8 (2.17%) | |||
| 700304 | Goodwell | 73942 | 75 (19.79%) | 297 (78.36%) | 7 (1.85%) | |||
| 700305 | 73942 | 172 (19.3%) | 701 (78.68%) | 18 (2.02%) | ||||
