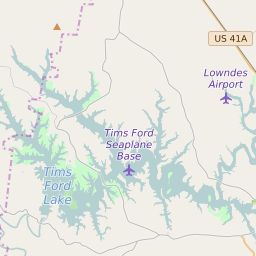
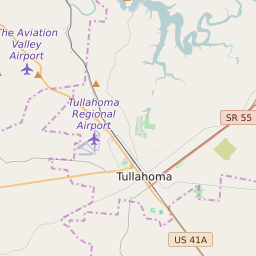
Map of Franklin County Precinct Level Results for the 2020 Presidential Election
D 80-100% |
D 70-80% |
D 60-70% |
D 45-60% |
R 45-60% |
R 60-70% |
R 70-80% |
R 80-100% |
List of Franklin County Precinct Level Results for the 2020 Presidential Election | |||||||||
|---|---|---|---|---|---|---|---|---|---|
| Map Index | Precinct | City/Town | ZIP Code | Joe Biden Democrat | Donald Trump Republican | Jo Jorgensen Libertarian | Howie Hawkins Green | ||
| 1-1 FC Annex | Winchester | 37398 | 707 (28.9%) | 1702 (69.58%) | 34 (1.39%) | 3 (0.12%) | |||
| 2-1 Clark Memorial | Decherd | 37330 | 674 (26.62%) | 1835 (72.47%) | 23 (0.91%) | 0 (0%) | |||
| 3-1 Broadview | 37388 | 160 (17.22%) | 761 (81.92%) | 5 (0.54%) | 3 (0.32%) | ||||
| 3-2 Huntland | Huntland | 37328 | 143 (16.29%) | 726 (82.69%) | 5 (0.57%) | 4 (0.46%) | |||
| 3-3 Walnut Grove | 37345 | 87 (19.12%) | 364 (80%) | 4 (0.88%) | 0 (0%) | ||||
| 4-1 Belvidere | Winchester | 37345 | 107 (20.94%) | 403 (78.86%) | 1 (0.2%) | 0 (0%) | |||
| 4-2 Cowan | Winchester | 37375 | 310 (23.61%) | 988 (75.25%) | 12 (0.91%) | 3 (0.23%) | |||
| 4-3 Liberty | Winchester | 37306 | 88 (13.64%) | 553 (85.74%) | 3 (0.47%) | 1 (0.16%) | |||
| 5-1 Keith Springs | 37306 | 34 (18.38%) | 148 (80%) | 3 (1.62%) | 0 (0%) | ||||
| 5-2 Sewanee | Monteagle | 37318 | 864 (70.02%) | 354 (28.69%) | 10 (0.81%) | 6 (0.49%) | |||
| 5-3 Sherwood | Sherwood | 37398 | 18 (11.11%) | 144 (88.89%) | 0 (0%) | 0 (0%) | |||
| 6-1 Alto/Oak Grove | 37324 | 143 (19.12%) | 598 (79.95%) | 3 (0.4%) | 4 (0.53%) | ||||
| 6-2 Capitol Hill | 37388 | 144 (17.41%) | 679 (82.1%) | 4 (0.48%) | 0 (0%) | ||||
| 6-3 UTSI | Tullahoma | 37388 | 215 (24.27%) | 651 (73.48%) | 20 (2.26%) | 0 (0%) | |||
| 7-1 North Lake | Tullahoma | 37330 | 327 (20.8%) | 1232 (78.37%) | 12 (0.76%) | 1 (0.06%) | |||
| 7-2 Winchester Springs & Center Grove | Estill Springs | 37398 | 252 (17.51%) | 1177 (81.79%) | 10 (0.69%) | 0 (0%) | |||
| 8-1 Decherd | Estill Springs | 37398 | 307 (33.01%) | 614 (66.02%) | 8 (0.86%) | 1 (0.11%) | |||
| 8-2 Estill Springs | Estill Springs | 37398 | 284 (21.04%) | 1058 (78.37%) | 7 (0.52%) | 1 (0.07%) | |||


