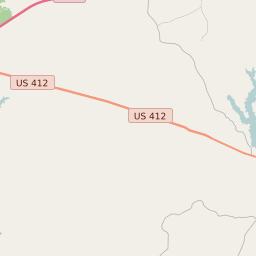
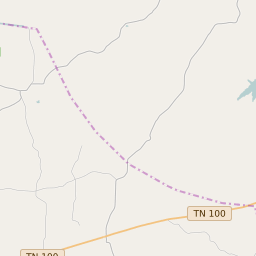
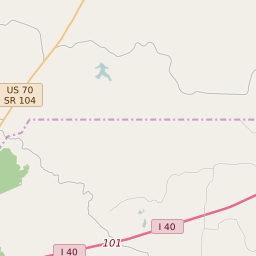
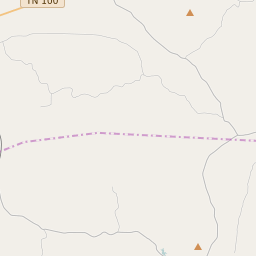
Map of Henderson County Precinct Level Results for the 2020 Presidential Election
D 80-100% |
D 70-80% |
D 60-70% |
D 45-60% |
R 45-60% |
R 60-70% |
R 70-80% |
R 80-100% |
List of Henderson County Precinct Level Results for the 2020 Presidential Election | |||||||||
|---|---|---|---|---|---|---|---|---|---|
| Map Index | Precinct | City/Town | ZIP Code | Joe Biden Democrat | Donald Trump Republican | Jo Jorgensen Libertarian | Howie Hawkins Green | ||
| 1-1 Bargerton | 38388 | 177 (19.47%) | 729 (80.2%) | 3 (0.33%) | 0 (0%) | ||||
| 1-2 Beaver | Wildersville | 38321 | 200 (27.74%) | 515 (71.43%) | 6 (0.83%) | 0 (0%) | |||
| 2-14 South Haven | Huron | 38351 | 50 (13.23%) | 327 (86.51%) | 1 (0.26%) | 0 (0%) | |||
| 2-15 Westover | Luray | 38352 | 187 (12.49%) | 1301 (86.91%) | 9 (0.6%) | 0 (0%) | |||
| 3-10 Fire Station #10 | 38388 | 149 (25.65%) | 426 (73.32%) | 6 (1.03%) | 0 (0%) | ||||
| 3-3 Fire Station #4 | Darden | 38374 | 126 (13.86%) | 779 (85.7%) | 4 (0.44%) | 0 (0%) | |||
| 3-7 Darden | Chesterfield | 38351 | 25 (6.08%) | 386 (93.92%) | 0 (0%) | 0 (0%) | |||
| 4-6 Natchez Trace | Lexington | 38351 | 398 (25.46%) | 1152 (73.7%) | 13 (0.83%) | 0 (0%) | |||
| 5-5 TN Tech Center | Huron | 38368 | 290 (19.67%) | 1176 (79.78%) | 8 (0.54%) | 0 (0%) | |||
| 6-8 Broad Street | Lexington | 38388 | 359 (18.92%) | 1516 (79.92%) | 21 (1.11%) | 1 (0.05%) | |||
| 7-11 Reagan | 38371 | 49 (9.07%) | 488 (90.37%) | 2 (0.37%) | 1 (0.19%) | ||||
| 7-12 Sardis | Sardis | 38370 | 23 (4.88%) | 439 (93.21%) | 6 (1.27%) | 3 (0.64%) | |||
| 7-13 Scotts Hill | Scotts Hill | 38368 | 40 (9.57%) | 377 (90.19%) | 1 (0.24%) | 0 (0%) | |||
| 7-9 Middleburg | 38328 | 19 (9.22%) | 186 (90.29%) | 0 (0%) | 1 (0.49%) | ||||


