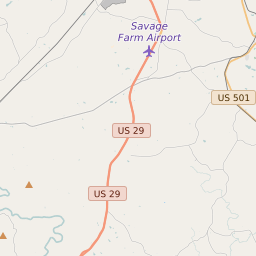
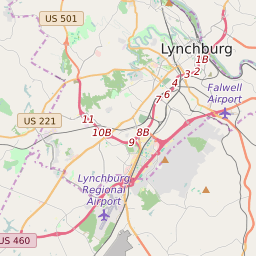
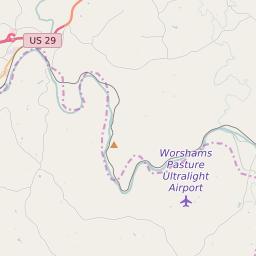
Map of Campbell County Precinct Level Results for the 2020 Presidential Election
D 80-100% |
D 70-80% |
D 60-70% |
D 45-60% |
R 45-60% |
R 60-70% |
R 70-80% |
R 80-100% |
List of Campbell County Precinct Level Results for the 2020 Presidential Election | ||||||||
|---|---|---|---|---|---|---|---|---|
| Map Index | Precinct | City/Town | ZIP Code | Joe Biden Democrat | Donald Trump Republican | Jo Jorgensen Libertarian | ||
| Altavista | Altavista | 24571 | 844 (42.12%) | 1132 (56.49%) | 28 (1.4%) | |||
| Bedford Springs | Timberlake | 24501 | 497 (20.89%) | 1833 (77.05%) | 49 (2.06%) | |||
| Brookneal | Brookneal | 24554 | 554 (37.26%) | 920 (61.87%) | 13 (0.87%) | |||
| Brookville | Timberlake | 24551 | 656 (25.9%) | 1828 (72.17%) | 49 (1.93%) | |||
| Concord | Concord | 24538 | 452 (21.73%) | 1596 (76.73%) | 32 (1.54%) | |||
| Court House | Rustburg | 24501 | 478 (20.7%) | 1780 (77.09%) | 51 (2.21%) | |||
| Evington | 24571 | 344 (29.03%) | 827 (69.79%) | 14 (1.18%) | ||||
| Gladys | 24517 | 491 (28.95%) | 1189 (70.11%) | 16 (0.94%) | ||||
| Kings | 24504 | 535 (28.92%) | 1298 (70.16%) | 17 (0.92%) | ||||
| Morris Church | 24554 | 274 (27.02%) | 729 (71.89%) | 11 (1.08%) | ||||
| New London | Timberlake | 24502 | 739 (26.11%) | 2040 (72.08%) | 51 (1.8%) | |||
| Otter River | Altavista | 24571 | 264 (27.02%) | 704 (72.06%) | 9 (0.92%) | |||
| Spring Hill | Timberlake | 24501 | 602 (27.02%) | 1582 (71.01%) | 44 (1.97%) | |||
| Three Forks | 24504 | 261 (15.92%) | 1345 (82.06%) | 33 (2.01%) | ||||
| Walker | Timberlake | 24550 | 643 (31.05%) | 1377 (66.49%) | 51 (2.46%) | |||
| Yellow Branch | 24554 | 436 (28.63%) | 1065 (69.93%) | 22 (1.44%) | ||||


