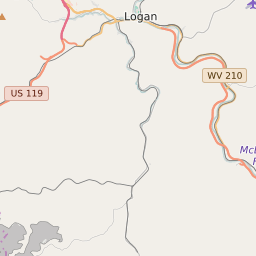
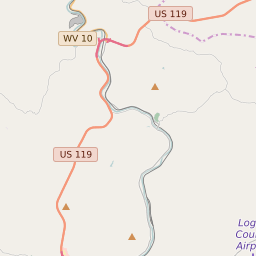
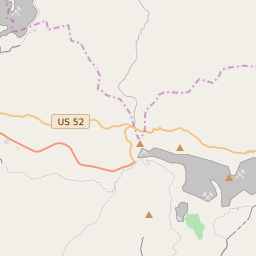
Map of Logan County Precinct Level Results for the 2020 Presidential Election
D 80-100% |
D 70-80% |
D 60-70% |
D 45-60% |
R 45-60% |
R 60-70% |
R 70-80% |
R 80-100% |
List of Logan County Precinct Level Results for the 2020 Presidential Election | ||||||||
|---|---|---|---|---|---|---|---|---|
| Map Index | Precinct | City/Town | ZIP Code | Joe Biden Democrat | Donald Trump Republican | Jo Jorgensen Libertarian | ||
| Voting District 1 | 25508 | 95 (18.1%) | 425 (80.95%) | 5 (0.95%) | ||||
| Voting District 10 | Henlawson | 25547 | 26 (13.27%) | 169 (86.22%) | 1 (0.51%) | |||
| Voting District 11 | Peach Creek | 25547 | 52 (17.63%) | 240 (81.36%) | 3 (1.02%) | |||
| Voting District 13 | West Logan | 25601 | 65 (32.99%) | 131 (66.5%) | 1 (0.51%) | |||
| Voting District 14 | Justice Addition | 25601 | 35 (19.02%) | 148 (80.43%) | 1 (0.54%) | |||
| Voting District 15 | Mitchell Heights | 25601 | 151 (21.76%) | 533 (76.8%) | 10 (1.44%) | |||
| Voting District 2 | Chapmanville | 25508 | 123 (15.69%) | 653 (83.29%) | 8 (1.02%) | |||
| Voting District 20 | Amherstdale | 25634 | 75 (15.59%) | 395 (82.12%) | 11 (2.29%) | |||
| Voting District 21 | Amherstdale | 25022 | 55 (15.9%) | 286 (82.66%) | 5 (1.45%) | |||
| Voting District 22 | 25022 | 24 (10.62%) | 198 (87.61%) | 4 (1.77%) | ||||
| Voting District 25 | Greenville | 25632 | 46 (10.95%) | 370 (88.1%) | 4 (0.95%) | |||
| Voting District 26 | Man | 25635 | 50 (13.26%) | 321 (85.15%) | 6 (1.59%) | |||
| Voting District 27 | Mallory | 25635 | 118 (17.25%) | 555 (81.14%) | 11 (1.61%) | |||
| Voting District 28 | Earling | 25635 | 39 (25.16%) | 113 (72.9%) | 3 (1.94%) | |||
| Voting District 31 | 25047 | 27 (17.88%) | 122 (80.79%) | 2 (1.32%) | ||||
| Voting District 36 | Logan | 25601 | 46 (23%) | 152 (76%) | 2 (1%) | |||
| Voting District 37 | Man | 25607 | 88 (20.37%) | 342 (79.17%) | 2 (0.46%) | |||
| Voting District 39 | Logan | 25601 | 130 (25.49%) | 379 (74.31%) | 1 (0.2%) | |||
| Voting District 4 | 25508 | 97 (15.3%) | 535 (84.38%) | 2 (0.32%) | ||||
| Voting District 41 | Stollings | 25601 | 35 (14.23%) | 210 (85.37%) | 1 (0.41%) | |||
| Voting District 43 | Holden | 25625 | 75 (18.61%) | 323 (80.15%) | 5 (1.24%) | |||
| Voting District 45A | 25638 | 77 (19.64%) | 313 (79.85%) | 2 (0.51%) | ||||
| Voting District 45B | 25652 | 31 (27.43%) | 81 (71.68%) | 1 (0.88%) | ||||
| Voting District 46 | Monaville | 25647 | 30 (11.9%) | 220 (87.3%) | 2 (0.79%) | |||
| Voting District 47 | Mount Gay-Shamrock | 25601 | 47 (21.36%) | 169 (76.82%) | 4 (1.82%) | |||
| Voting District 49 | Omar | 25652 | 73 (12.87%) | 492 (86.77%) | 2 (0.35%) | |||
| Voting District 50 | Sarah Ann | 25644 | 84 (23.4%) | 270 (75.21%) | 5 (1.39%) | |||
| Voting District 53 | Verdunville | 25508 | 87 (16.76%) | 428 (82.47%) | 4 (0.77%) | |||
| Voting District 54 | Mount Gay-Shamrock | 25601 | 94 (31.65%) | 200 (67.34%) | 3 (1.01%) | |||
| Voting District 55 | Mount Gay-Shamrock | 25601 | 59 (20.21%) | 231 (79.11%) | 2 (0.68%) | |||
| Voting District 5A | Chapmanville | 25508 | 78 (18.31%) | 343 (80.52%) | 5 (1.17%) | |||
| Voting District 5B | 25508 | 3 (13.04%) | 17 (73.91%) | 3 (13.04%) | ||||
| Voting District 6 | 25508 | 95 (18.03%) | 425 (80.65%) | 7 (1.33%) | ||||
| Voting District 7A | Chapmanville | 25508 | 22 (16.92%) | 106 (81.54%) | 2 (1.54%) | |||
| Voting District 7B | 25508 | 66 (17.05%) | 319 (82.43%) | 2 (0.52%) | ||||
| Voting District 8 | 25108 | 35 (9.8%) | 320 (89.64%) | 2 (0.56%) | ||||


