Smith Elementary School - Profile and Attendance Area Map
| Smith Elementary School Profile and Stats | |
|---|---|
| School Name | Smith Elementary School |
| District | Milford Exempted Village School District |
| Address | 1052 Jer Les St Milford, 45150 |
| County | Clermont County |
| Enrollment | 513 |
| Majority Ethnicity/Race | White: 92% |
| Free or Reduced Lunch Program | 8.60% |
| Title 1 School | No |
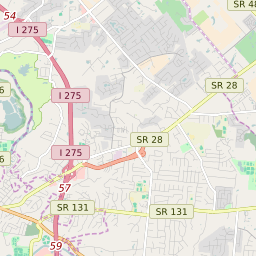
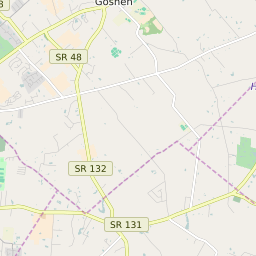
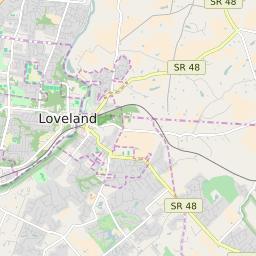
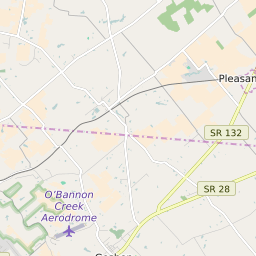
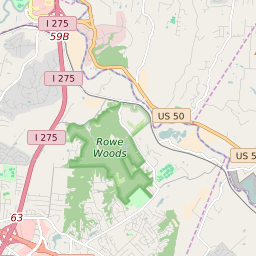
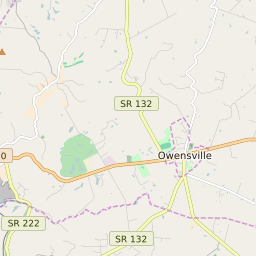
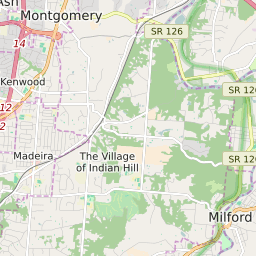
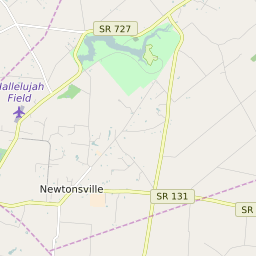
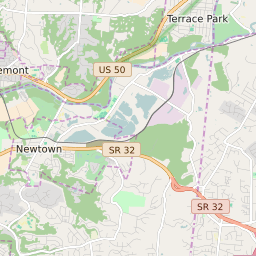
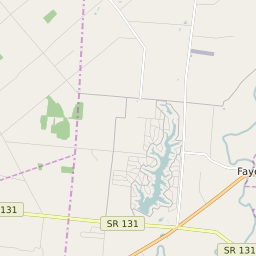
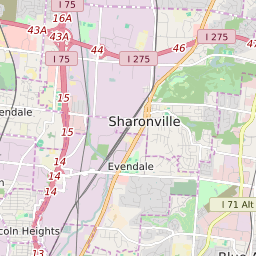
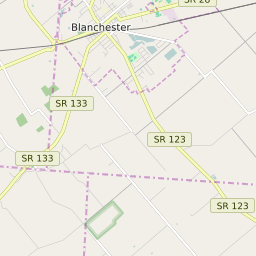
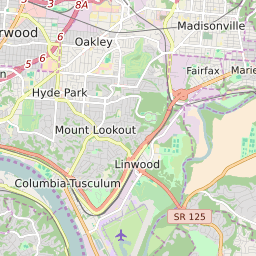
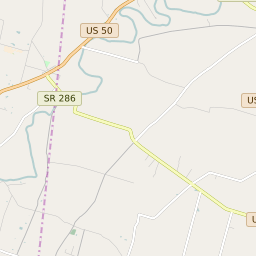
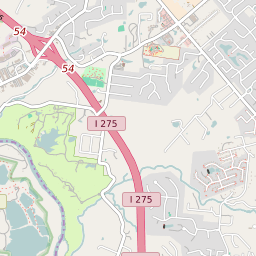
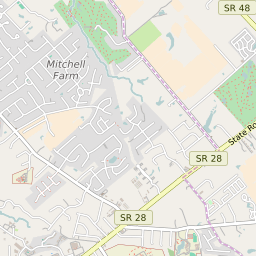
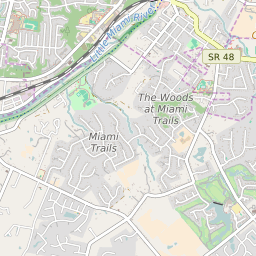
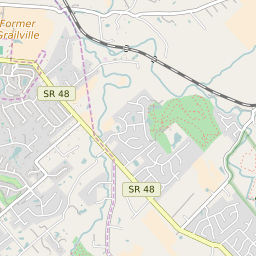
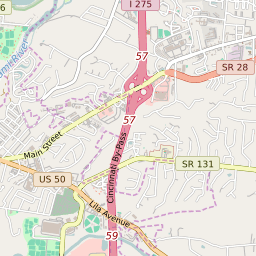
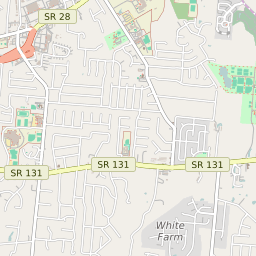
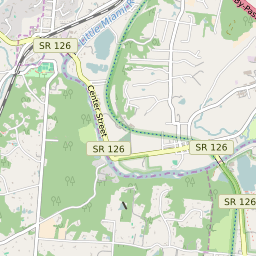
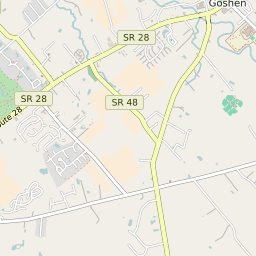
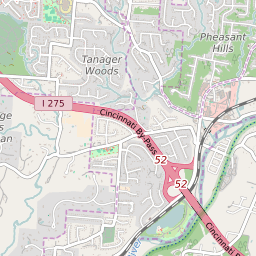
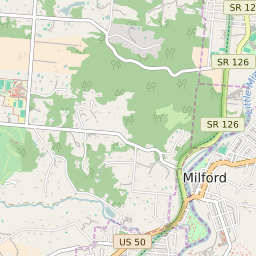
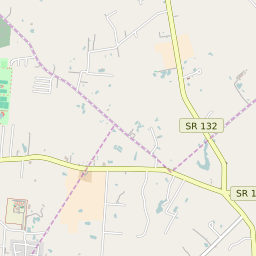
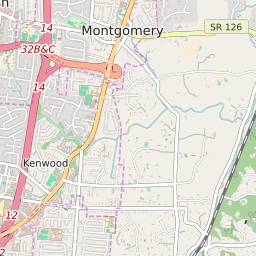
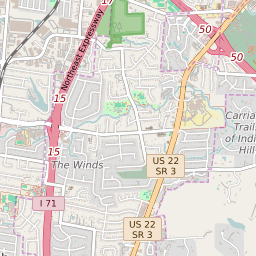
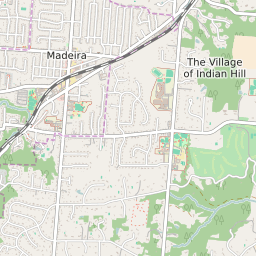
Smith Elementary School Attendance Zone Map


| Smith Elementary School Student Demographics | ||
|---|---|---|
| Asian | 15 | 2.92% |
| Black/African American | 5 | 0.97% |
| Hispanic | 10 | 1.95% |
| Native American | 0 | 0% |
| Pacific Islander | 0 | 0% |
| White | 472 | 92.01% |
| Mixed Race | 11 | 2.14% |