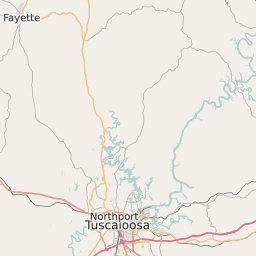
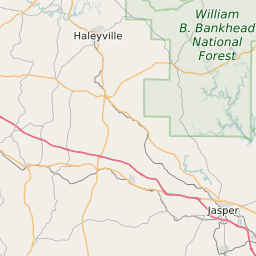
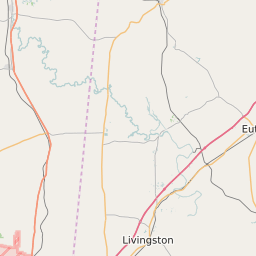
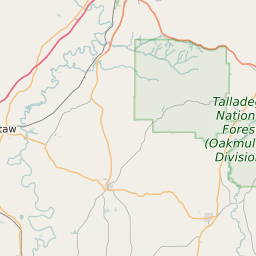
Map of Tuscaloosa County School District Elementary School Race and Ethnicity
White |
Black |
Asian |
Hispanic |
Native American |
Hawaiian/Pacific Islander |
No Data |
Click on the map for more information about each school boundary. Add City/Town and County Boundaries to the map using the icon in the upper right corner of the map.


Change Map:
List of Elementary Schools in Tuscaloosa County School District Alabama
| Map Key | School Name | ZIP Code | City | Majority Race/Ethnicity | ||
|---|---|---|---|---|---|---|
| Big Sandy Elementary School | 35474 | Moundville | White: 55% | |||
| Brookwood Elementary School | 35444 | Brookwood | White: 85% | |||
| Buhl Elementary School | 35446 | Buhl | White: 85% | |||
| Cottondale Elementary School | 35453 | Cottondale | White: 42% | |||
| Crestmont Elementary School | 35476 | Northport | Black: 53% | |||
| Englewood Elementary School | 35405 | Tuscaloosa | Black: 64% | |||
| Faucett-Vestavia Elementary School | 35473 | Northport | White: 61% | |||
| Flatwoods Elementary School | 35473 | Northport | Black: 43% | |||
| Holt Elementary School | 35404 | Tuscaloosa | Black: 57% | |||
| Huntington Place Elementary School | 35475 | Northport | White: 84% | |||
| Lake View Elementary School | 35111 | McCalla | White: 85% | |||
| Matthews Elementary School | 35476 | Northport | Black: 59% | |||
| Maxwell Elementary School | 35456 | Duncanville | White: 64% | |||
| Myrtlewood Elementary School | 35463 | Fosters | White: 62% | |||
| Vance Elementary School | 35490 | Vance | White: 68% | |||
| Walker Elementary School | 35475 | Northport | White: 92% | |||
| Westwood Elementary School | 35452 | Coker | White: 82% |