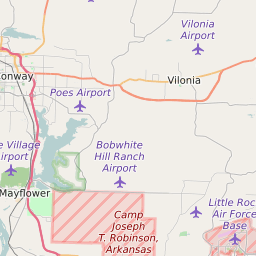
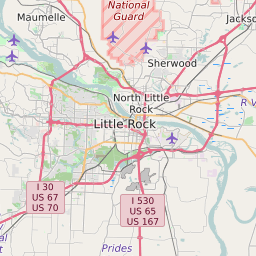
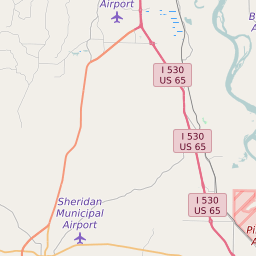
Map of Pulaski County Special School District Elementary School Free and Reduced Lunch Program Participation
< 20% |
20 - 40% |
40 - 60% |
60 - 80% |
> 80% |
No Data |
Click on the map for more information about each school boundary. Add City/Town and County Boundaries to the map using the icon in the upper right corner of the map.
Change Map:
List of Elementary Schools in Pulaski County Special School District Arkansas
| Map Key | School Name | ZIP Code | City | Free/Reduced Lunch Program Participation | ||
|---|---|---|---|---|---|---|
| Baker Elementary School | 72223 | Little Rock | 15.86% | |||
| Bates Elementary School | 72206 | Little Rock | 100.00% | |||
| Cato Elementary School | 72120 | North Little Rock | 100.00% | |||
| Chenal Elementary School | 72223 | Little Rock | 16.40% | |||
| Clinton Elementary School | 72120 | Sherwood | 100.00% | |||
| College Station Elementary School | 72053 | College Station | 99.26% | |||
| Crystal Hill Elementary School | 72118 | North Little Rock | 100.00% | |||
| Harris Elementary School | 72117 | North Little Rock | 100.00% | |||
| Landmark Elementary School | 72206 | Little Rock | 100.00% | |||
| Lawson Elementary School | 72210 | Little Rock | 100.00% | |||
| Oak Grove Elementary School | 72118 | North Little Rock | 99.44% | |||
| Oakbrooke Elementary School | 72120 | Sherwood | 47.24% | |||
| Pine Forest Elementary School | 72113 | Maumelle | 47.69% | |||
| Robinson Elementary School | 72223 | Little Rock | 27.39% | |||
| Sherwood Elementary School | 72120 | Sherwood | 44.31% | |||
| Sylvan Hills Elementary School | 72120 | Sherwood | 38.24% |


