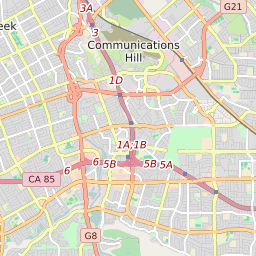
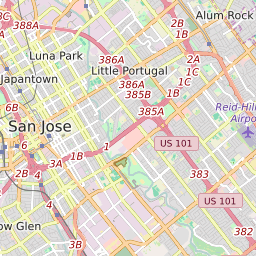
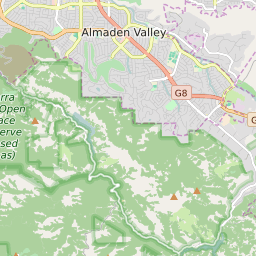
Map of Oak Grove Elementary School District Elementary School Free and Reduced Lunch Program Participation
< 20% |
20 - 40% |
40 - 60% |
60 - 80% |
> 80% |
No Data |
Click on the map for more information about each school boundary. Add City/Town and County Boundaries to the map using the icon in the upper right corner of the map.
Change Map:
List of Elementary Schools in Oak Grove Elementary School District California
| Map Key | School Name | ZIP Code | City | Free/Reduced Lunch Program Participation | ||
|---|---|---|---|---|---|---|
| Alex Anderson Elementary School | 95123 | San Jose | 34.64% | |||
| Bertha Taylor Elementary School | 95123 | San Jose | 14.40% | |||
| Christopher Elementary School | 95111 | San Jose | 42.41% | |||
| Del Roble Elementary School | 95123 | San Jose | 21.20% | |||
| Edenvale Elementary School | 95111 | San Jose | 50.95% | |||
| Frost Elementary School | 95123 | San Jose | 18.01% | |||
| Hayes Elementary School | 95136 | San Jose | 33.46% | |||
| Julia Baldwin Elementary School | 95119 | San Jose | 28.66% | |||
| Ledesma Elementary School | 95138 | San Jose | 18.98% | |||
| Oak Ridge Elementary School | 95123 | San Jose | 17.71% | |||
| Parkview Elementary School | 95136 | San Jose | 32.24% | |||
| Sakamoto Elementary School | 95123 | San Jose | 12.65% | |||
| Santa Teresa Elementary School | 95119 | San Jose | 13.37% | |||
| Stipe Elementary School | 95111 | San Jose | 42.20% |


