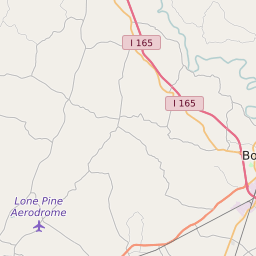
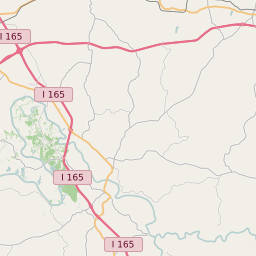
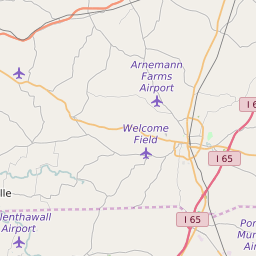
Map of Warren County School District Elementary School Free and Reduced Lunch Program Participation
< 20% |
20 - 40% |
40 - 60% |
60 - 80% |
> 80% |
No Data |
Click on the map for more information about each school boundary. Add City/Town and County Boundaries to the map using the icon in the upper right corner of the map.
Change Map:
List of Elementary Schools in Warren County School District Kentucky
| Map Key | School Name | ZIP Code | City | Free/Reduced Lunch Program Participation | ||
|---|---|---|---|---|---|---|
| Alvaton Elementary School | 42122 | Alvaton | 42.97% | |||
| Briarwood Elementary School | 42103 | Bowling Green | 60.29% | |||
| Bristow Elementary School | 42101 | Bowling Green | 66.73% | |||
| Cumberland Trace Elementary School | 42103 | Bowling Green | 42.97% | |||
| Jody Richards Elementary School | 42104 | Bowling Green | 44.38% | |||
| Lost River Elementary School | 42101 | Bowling Green | 79.81% | |||
| Natcher Elementary School | 42104 | Bowling Green | 71.72% | |||
| North Warren Elementary School | 42171 | Smiths Grove | 56.76% | |||
| Oakland Elementary School | 42159 | Oakland | 82.01% | |||
| Plano Elementary School | 42104 | Bowling Green | 47.20% | |||
| Rich Pond Elementary School | 42104 | Bowling Green | 42.93% | |||
| Richardsville Elementary School | 42101 | Bowling Green | 64.62% | |||
| Rockfield Elementary School | 42101 | Bowling Green | 60.03% | |||
| Warren Elementary School | 42101 | Bowling Green | 83.49% |


