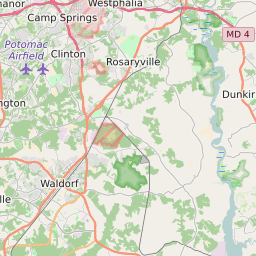
Map of Charles County, Maryland Elementary School Free and Reduced Lunch Program Participation
< 20% |
20 - 40% |
40 - 60% |
60 - 80% |
> 80% |
No Data |
Click on the map for more information about each school boundary. Add City/Town and County Boundaries to the map using the icon in the upper right corner of the map.

Change Map:
List of Elementary Schools in Charles County Maryland
| Map Key | School Name | School District | City | Free/Reduced Lunch Program Participation | ||
|---|---|---|---|---|---|---|
| Arthur Middleton Elementary School | Charles County Public Schools | Waldorf | 46.42% | |||
| Barnhart Elementary School | Charles County Public Schools | Waldorf | 47.78% | |||
| Berry Elementary School | Charles County Public Schools | Waldorf | 35.85% | |||
| Brown Elementary School | Charles County Public Schools | Waldorf | 63.64% | |||
| Craik Elementary School | Charles County Public Schools | Pomfret | 29.26% | |||
| Diggs Elementary School | Charles County Public Schools | Waldorf | 23.88% | |||
| Eva Turner Elementary School | Charles County Public Schools | Waldorf | 63.66% | |||
| Gale-Bailey Elementary School | Charles County Public Schools | Marbury | 39.08% | |||
| Higdon Elementary School | Charles County Public Schools | Newburg | 34.25% | |||
| Indian Head Elementary School | Charles County Public Schools | Indian Head | 63.94% | |||
| Jenifer Elementary School | Charles County Public Schools | Waldorf | 52.61% | |||
| Malcolm Elementary School | Charles County Public Schools | Waldorf | 35.56% | |||
| Martin Elementary School | Charles County Public Schools | Bryantown | 27.02% | |||
| Mary Matula Elementary School | Charles County Public Schools | La Plata | 27.87% | |||
| Mitchell Elementary School | Charles County Public Schools | La Plata | 26.92% | |||
| Mt Hope/Nanjemoy Elementary School | Charles County Public Schools | Nanjemoy | 52.61% | |||
| Mudd Elementary School | Charles County Public Schools | Waldorf | 70.85% | |||
| Neal Elementary School | Charles County Public Schools | Waldorf | 30.68% | |||
| Parks Elementary School | Charles County Public Schools | Indian Head | 42.74% | |||
| Ryon Elementary School | Charles County Public Schools | Waldorf | 61.27% | |||
| Wade Elementary School | Charles County Public Schools | Waldorf | 41.20% |