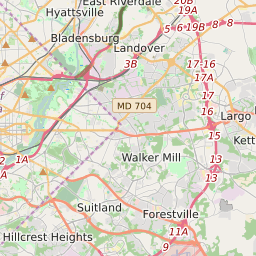
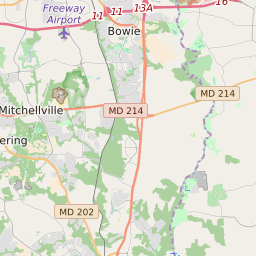
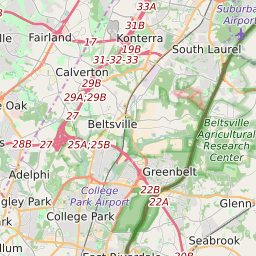
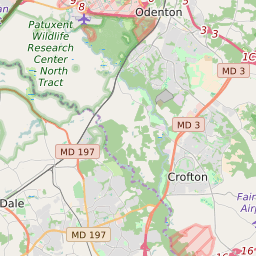
Map of ZIP Code 20774, Maryland Elementary School Free and Reduced Lunch Program Participation
< 20% |
20 - 40% |
40 - 60% |
60 - 80% |
> 80% |
No Data |
Click on the map for more information about each school boundary. Add City/Town and County Boundaries to the map using the icon in the upper right corner of the map.
Change Map:
List of Elementary Schools in ZIP Code 20774 Maryland
| Map Key | School Name | School District | City | Free/Reduced Lunch Program Participation | ||
|---|---|---|---|---|---|---|
| Ardmore Elementary School | Prince George's County Public Schools | Springdale | 63.59% | |||
| Gaywood Elementary School | Prince George's County Public Schools | Lanham | 81.69% | |||
| Glenn Dale Elementary School | Prince George's County Public Schools | Glenn Dale | 64.45% | |||
| Glenridge Elementary School | Prince George's County Public Schools | Landover Hills | 85.07% | |||
| Greenbelt Elementary School | Prince George's County Public Schools | Greenbelt | 53.09% | |||
| Kingsford Elementary School | Prince George's County Public Schools | Mitchellville | 51.11% | |||
| Lamont Elementary School | Prince George's County Public Schools | New Carrollton | 81.54% | |||
| Magnolia Elementary School | Prince George's County Public Schools | Lanham | 66.28% | |||
| McHenry Elementary School | Prince George's County Public Schools | Lanham | 82.63% | |||
| Reed Elementary School | Prince George's County Public Schools | Lanham | 81.12% | |||
| Robert Frost Elementary School | Prince George's County Public Schools | New Carrollton | 80.36% | |||
| Seabrook Elementary School | Prince George's County Public Schools | Seabrook | 77.27% | |||
| William Paca Elementary School | Prince George's County Public Schools | Landover | 90.63% | |||
| Woods Elementary School | Prince George's County Public Schools | Glenarden | 88.11% |