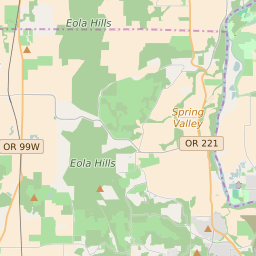
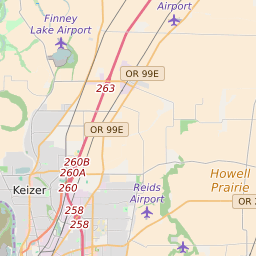
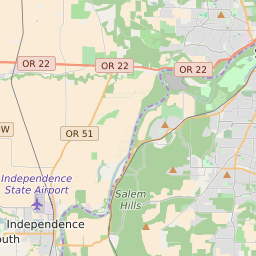
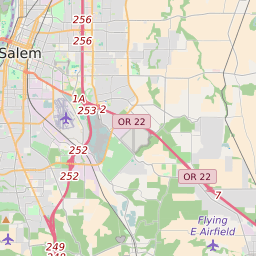
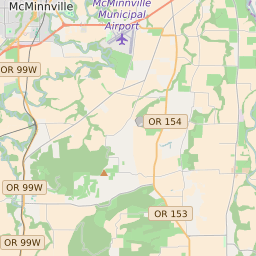
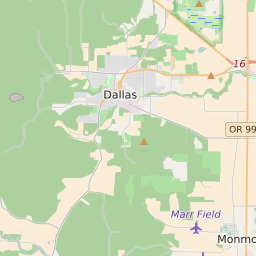
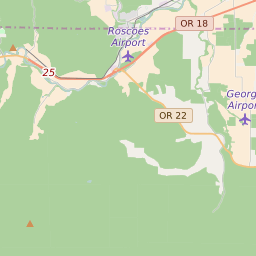
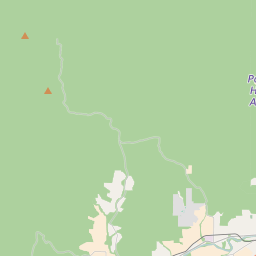
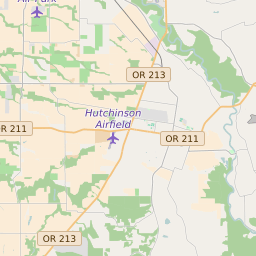
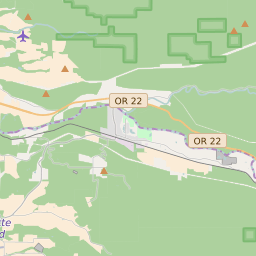
Map of Polk County, Oregon Elementary School Free and Reduced Lunch Program Participation
< 20% |
20 - 40% |
40 - 60% |
60 - 80% |
> 80% |
No Data |
Click on the map for more information about each school boundary. Add City/Town and County Boundaries to the map using the icon in the upper right corner of the map.
Change Map:
List of Elementary Schools in Polk County Oregon
| Map Key | School Name | School District | City | Free/Reduced Lunch Program Participation | ||
|---|---|---|---|---|---|---|
| Ash Creek Elementary School | Central School District 13J | Monmouth | 58.80% | |||
| Brush College Elementary School | Salem-Keizer School District 24J | Salem | 35.50% | |||
| Chapman Hill Elementary School | Salem-Keizer School District 24J | Salem | 35.00% | |||
| Falls City Elementary School | Falls City School District 57 | Falls City | 70.40% | |||
| Harritt Elementary School | Salem-Keizer School District 24J | Salem | 57.40% | |||
| Independence Elementary School | Central School District 13J | Independence | 70.40% | |||
| Kalapuya Elementary School | Salem-Keizer School District 24J | Salem | 34.40% | |||
| Lyle Elementary School | Dallas School District 2 | Dallas | 53.30% | |||
| Monmouth Elementary School | Central School District 13J | Monmouth | 46.30% | |||
| Myers Elementary School | Salem-Keizer School District 24J | Salem | 40.80% |