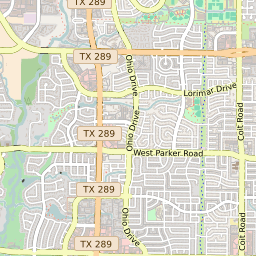
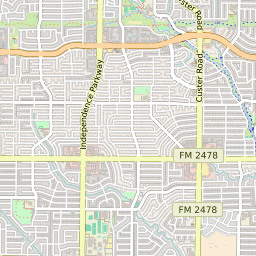
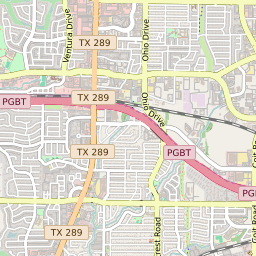
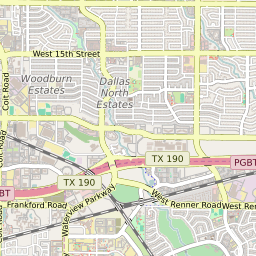
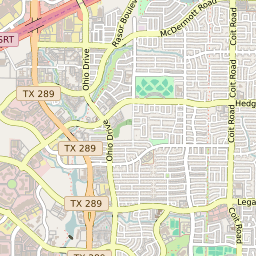
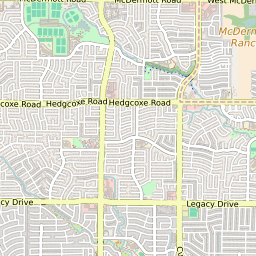
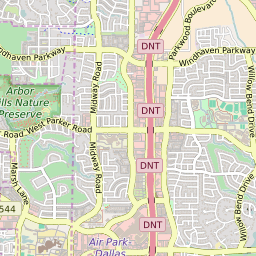
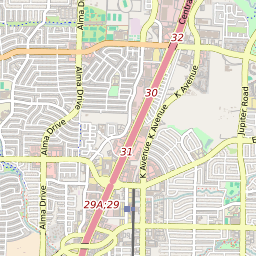
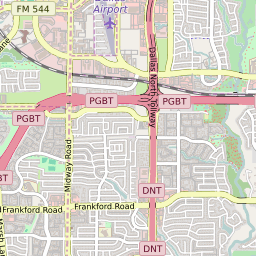
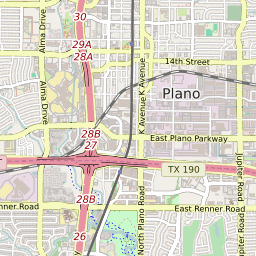
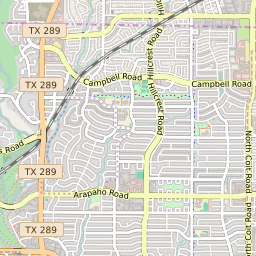
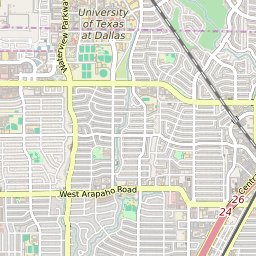
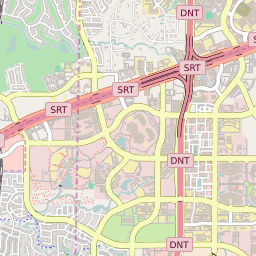
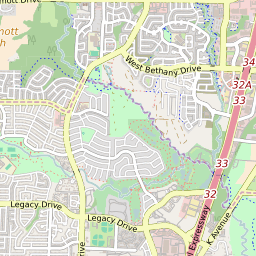
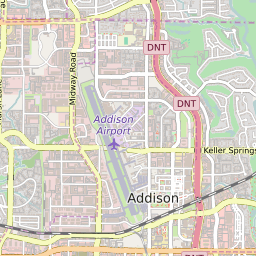
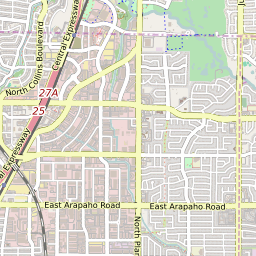
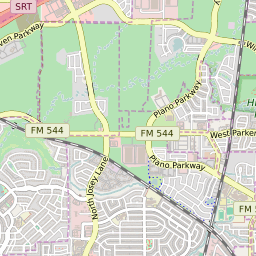
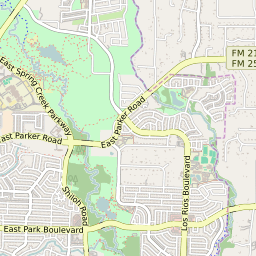
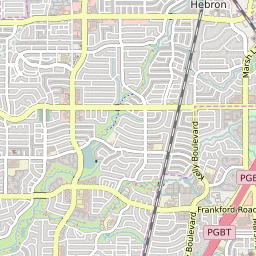
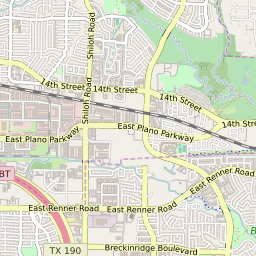
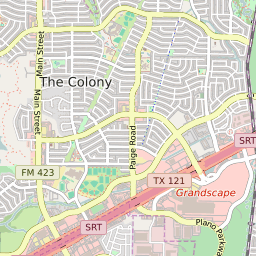
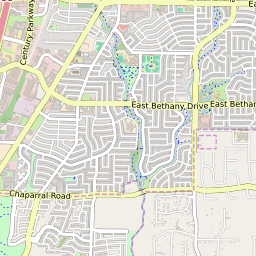
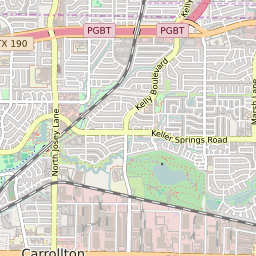
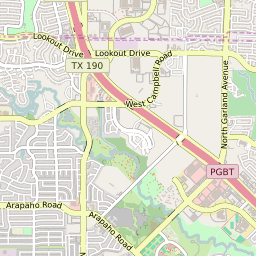
Map of ZIP Code 75093, Texas Elementary School Free and Reduced Lunch Program Participation
< 20% |
20 - 40% |
40 - 60% |
60 - 80% |
> 80% |
No Data |
Click on the map for more information about each school boundary. Add City/Town and County Boundaries to the map using the icon in the upper right corner of the map.
Change Map:
List of Elementary Schools in ZIP Code 75093 Texas
| Map Key | School Name | School District | City | Free/Reduced Lunch Program Participation | ||
|---|---|---|---|---|---|---|
| Barksdale Elementary School | Plano Independent School District | Plano | 14.60% | |||
| Brinker Elementary School | Plano Independent School District | Plano | 22.64% | |||
| Centennial Elementary School | Plano Independent School District | Plano | 7.73% | |||
| Daffron Elementary School | Plano Independent School District | Plano | 48.96% | |||
| Hightower Elementary School | Plano Independent School District | Plano | 21.49% | |||
| Homestead Elementary School | Lewisville Independent School District | Carrollton | 16.10% | |||
| Huffman Elementary School | Plano Independent School District | Plano | 56.14% | |||
| Indian Creek Elementary School | Lewisville Independent School District | Carrollton | 32.53% | |||
| Jackson Elementary School | Plano Independent School District | Plano | 71.00% | |||
| Saigling Elementary School | Plano Independent School District | Plano | 16.23% | |||
| Weatherford Elementary School | Plano Independent School District | Plano | 66.17% |