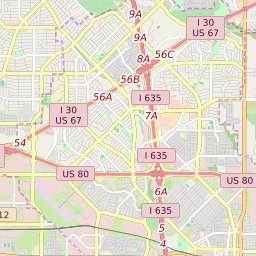
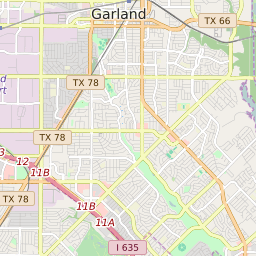
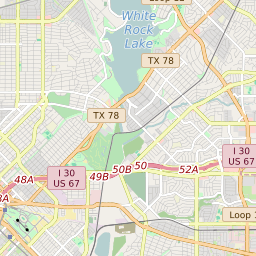
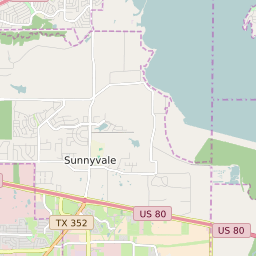
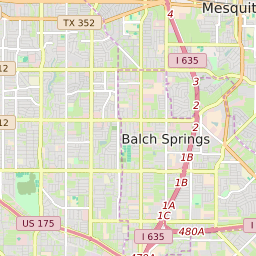
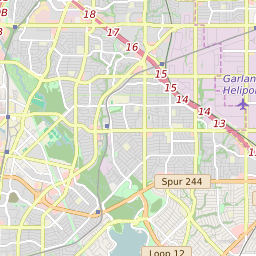
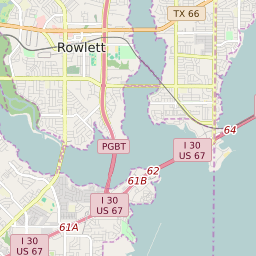
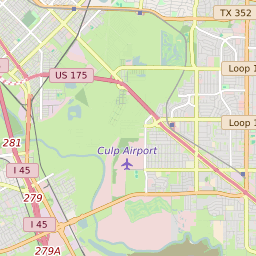
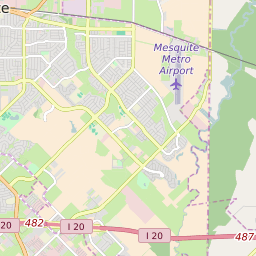
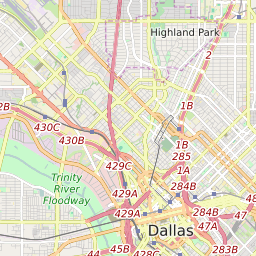
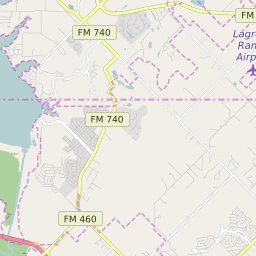
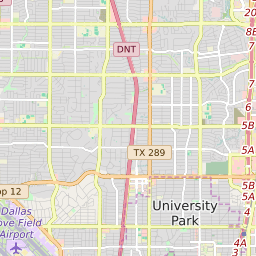
Map of ZIP Code 75150, Texas Elementary School Free and Reduced Lunch Program Participation
< 20% |
20 - 40% |
40 - 60% |
60 - 80% |
> 80% |
No Data |
Click on the map for more information about each school boundary. Add City/Town and County Boundaries to the map using the icon in the upper right corner of the map.
Change Map:
List of Elementary Schools in ZIP Code 75150 Texas
| Map Key | School Name | School District | City | Free/Reduced Lunch Program Participation | ||
|---|---|---|---|---|---|---|
| Austin Elementary School | Mesquite Independent School District | Mesquite | 65.99% | |||
| Beasley Elementary School | Mesquite Independent School District | Mesquite | 63.56% | |||
| Cannaday Elementary School | Mesquite Independent School District | Mesquite | 83.25% | |||
| Florence Elementary School | Mesquite Independent School District | Mesquite | 82.84% | |||
| Kimball Elementary School | Mesquite Independent School District | Mesquite | 71.50% | |||
| Lawrence Elementary School | Mesquite Independent School District | Mesquite | 84.81% | |||
| Mckenzie Elementary School | Mesquite Independent School District | Mesquite | 86.12% | |||
| Motley Elementary School | Mesquite Independent School District | Mesquite | 86.03% | |||
| Porter Elementary School | Mesquite Independent School District | Mesquite | 74.30% | |||
| Price Elementary School | Mesquite Independent School District | Garland | 81.21% | |||
| Range Elementary School | Mesquite Independent School District | Mesquite | 89.43% | |||
| Shands Elementary School | Mesquite Independent School District | Mesquite | 85.03% | |||
| Shaw Elementary School | Mesquite Independent School District | Mesquite | 77.21% | |||
| Smith Elementary School | Dallas Independent School District | Mesquite | 93.58% | |||
| Sunnyvale Elementary School | Sunnyvale Independent School District | Sunnyvale | 20.84% | |||
| Tosch Elementary School | Mesquite Independent School District | Mesquite | 86.55% |