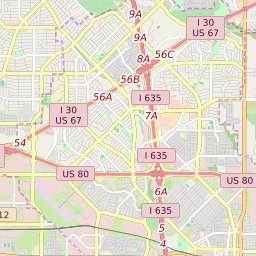
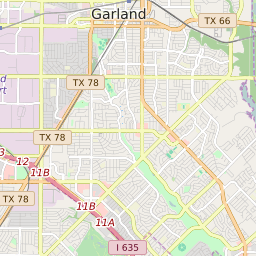
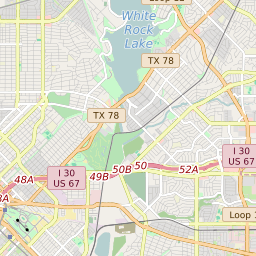
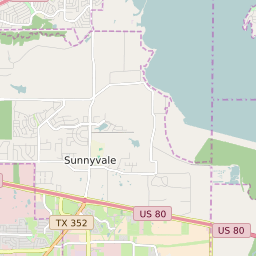
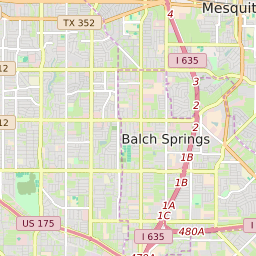
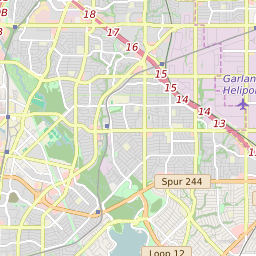
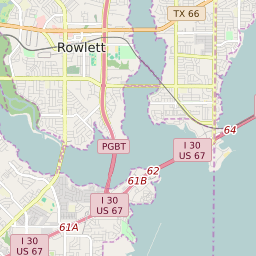
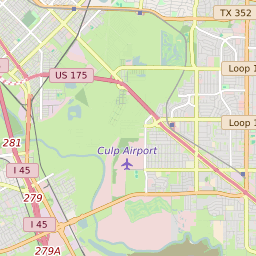
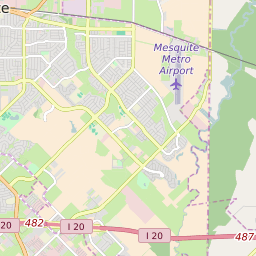
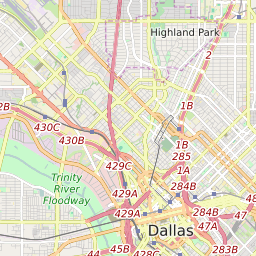
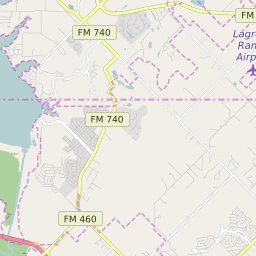
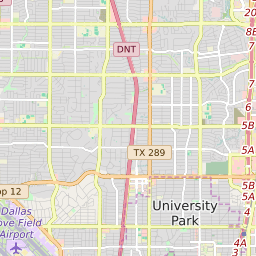
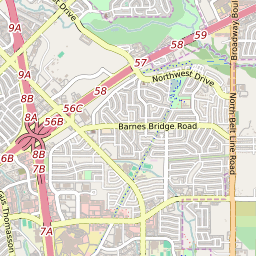
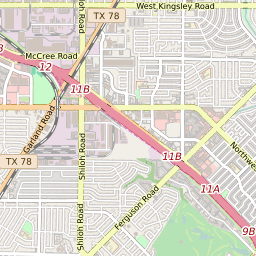
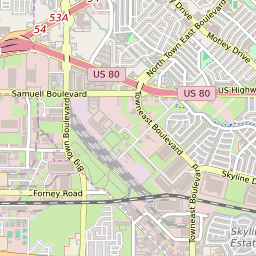
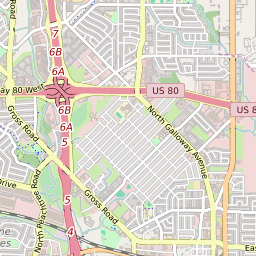
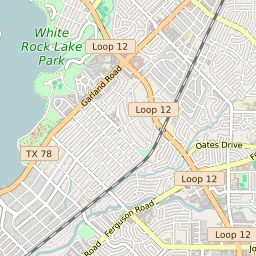
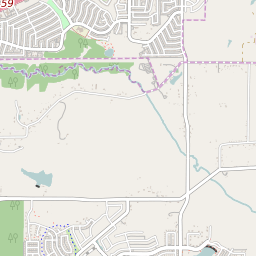
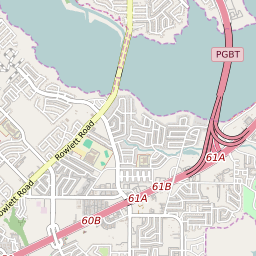
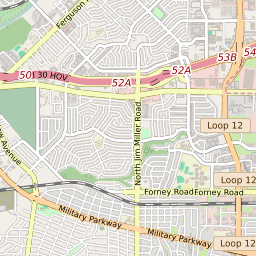
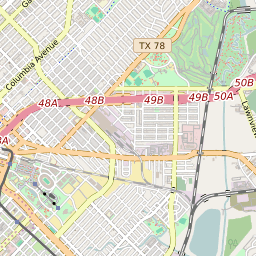
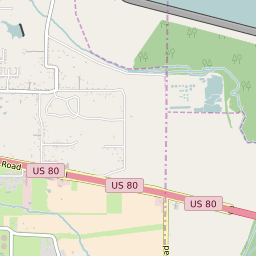
Map of ZIP Code 75150, Texas Elementary School Race and Ethnicity
White |
Black |
Asian |
Hispanic |
Native American |
Hawaiian/Pacific Islander |
No Data |
Click on the map for more information about each school boundary. Add City/Town and County Boundaries to the map using the icon in the upper right corner of the map.


Change Map:
List of Elementary Schools in ZIP Code 75150 Texas
| Map Key | School Name | School District | City | Majority Race/Ethnicity | ||
|---|---|---|---|---|---|---|
| Austin Elementary School | Mesquite Independent School District | Mesquite | Hispanic: 44% | |||
| Beasley Elementary School | Mesquite Independent School District | Mesquite | Hispanic: 37% | |||
| Cannaday Elementary School | Mesquite Independent School District | Mesquite | Hispanic: 44% | |||
| Florence Elementary School | Mesquite Independent School District | Mesquite | Hispanic: 66% | |||
| Kimball Elementary School | Mesquite Independent School District | Mesquite | Hispanic: 34% | |||
| Lawrence Elementary School | Mesquite Independent School District | Mesquite | Hispanic: 75% | |||
| Mckenzie Elementary School | Mesquite Independent School District | Mesquite | Hispanic: 62% | |||
| Motley Elementary School | Mesquite Independent School District | Mesquite | Hispanic: 83% | |||
| Porter Elementary School | Mesquite Independent School District | Mesquite | Hispanic: 66% | |||
| Price Elementary School | Mesquite Independent School District | Garland | Black: 43% | |||
| Range Elementary School | Mesquite Independent School District | Mesquite | Hispanic: 71% | |||
| Shands Elementary School | Mesquite Independent School District | Mesquite | Hispanic: 72% | |||
| Shaw Elementary School | Mesquite Independent School District | Mesquite | Hispanic: 46% | |||
| Smith Elementary School | Dallas Independent School District | Mesquite | Hispanic: 75% | |||
| Sunnyvale Elementary School | Sunnyvale Independent School District | Sunnyvale | White: 49% | |||
| Tosch Elementary School | Mesquite Independent School District | Mesquite | Hispanic: 64% |