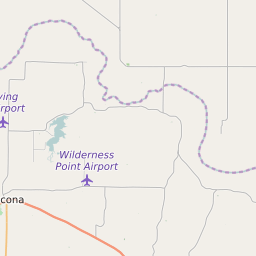
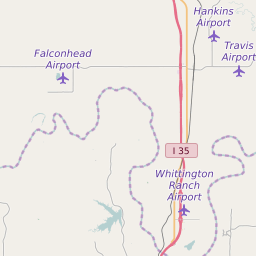
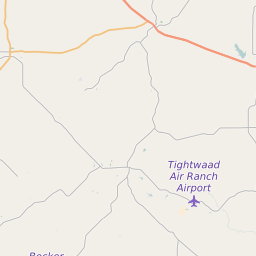
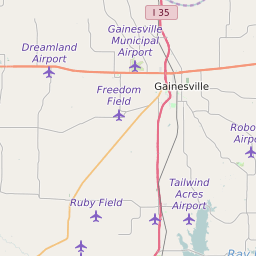
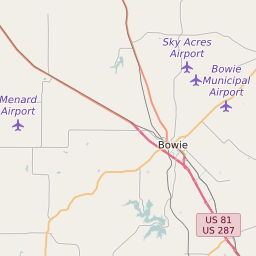
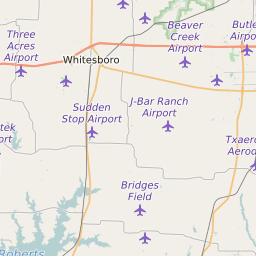
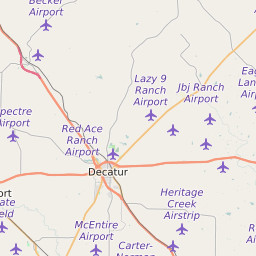
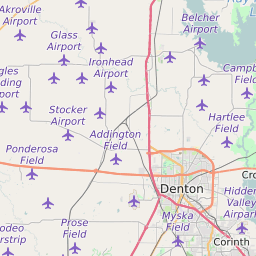
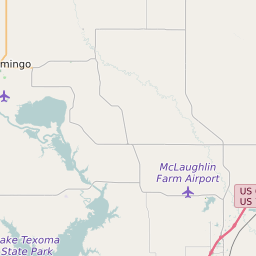
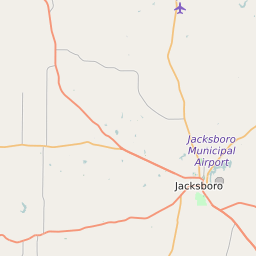
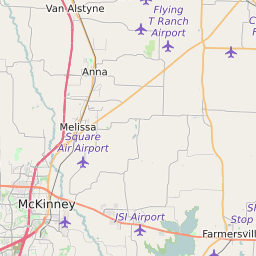
Map of ZIP Code 76255, Texas Elementary School Free and Reduced Lunch Program Participation
< 20% |
20 - 40% |
40 - 60% |
60 - 80% |
> 80% |
No Data |
Click on the map for more information about each school boundary. Add City/Town and County Boundaries to the map using the icon in the upper right corner of the map.

Change Map:
List of Elementary Schools in ZIP Code 76255 Texas
| Map Key | School Name | School District | City | Free/Reduced Lunch Program Participation | ||
|---|---|---|---|---|---|---|
| Nocona Elementary School | Nocona Independent School District | Nocona | 64.31% | |||
| Prairie Valley Elementary School | Prairie Valley Independent School District | Nocona | 68.85% | |||
| Saint Jo Elementary School | Saint Jo Independent School District | SAINT JO | 43.68% |