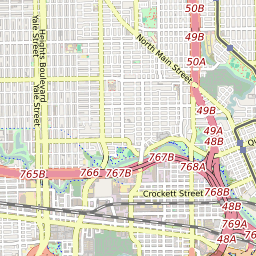
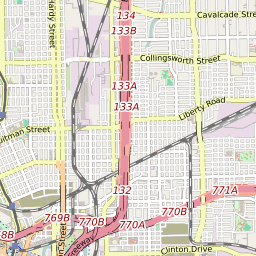
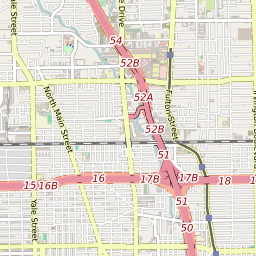
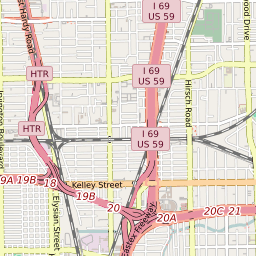
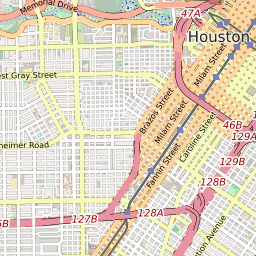
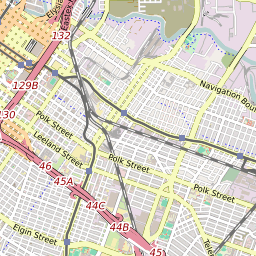
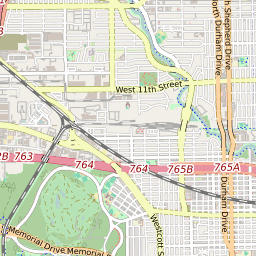
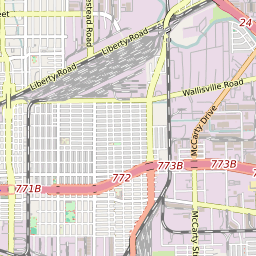
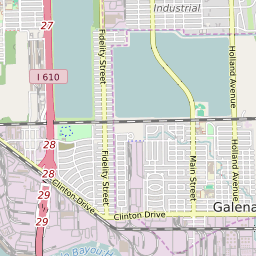
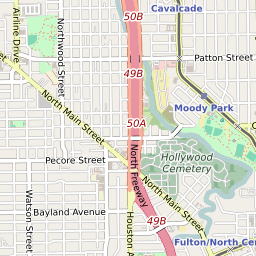
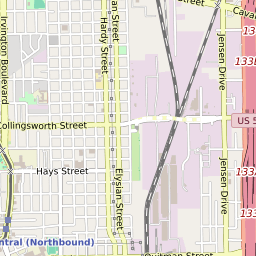
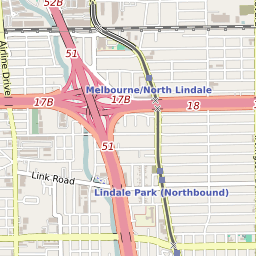
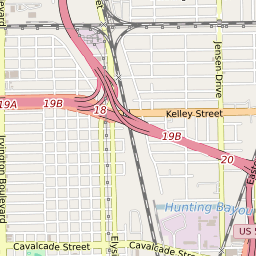
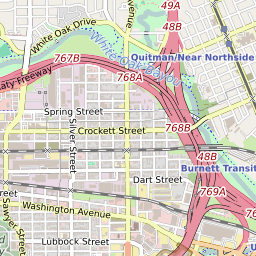
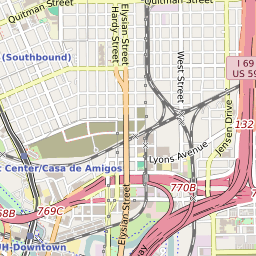
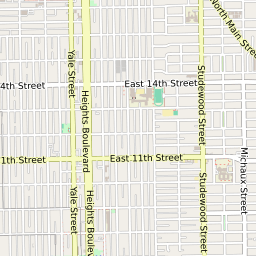
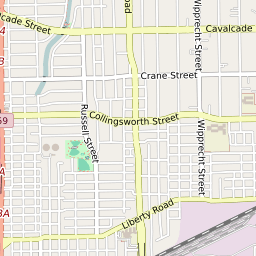
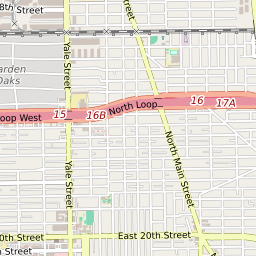
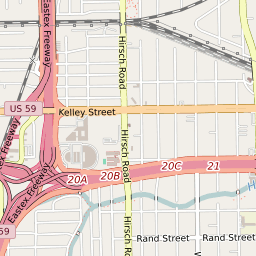
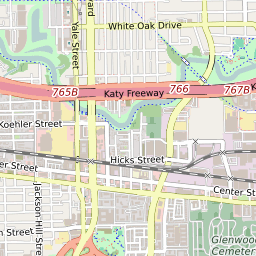
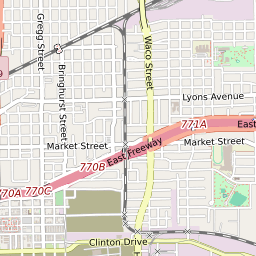
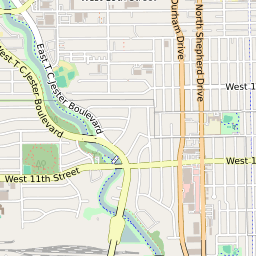
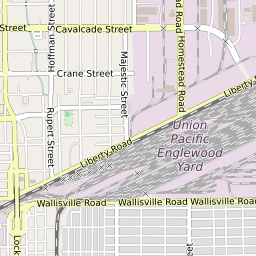
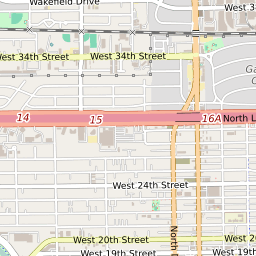
Map of ZIP Code 77009, Texas Elementary School Free and Reduced Lunch Program Participation
< 20% |
20 - 40% |
40 - 60% |
60 - 80% |
> 80% |
No Data |
Click on the map for more information about each school boundary. Add City/Town and County Boundaries to the map using the icon in the upper right corner of the map.

Change Map:
List of Elementary Schools in ZIP Code 77009 Texas
| Map Key | School Name | School District | City | Free/Reduced Lunch Program Participation | ||
|---|---|---|---|---|---|---|
| Browning Elementary School | Houston Independent School District | Houston | 90.07% | |||
| Field Elementary School | Houston Independent School District | Houston | 66.59% | |||
| Jefferson Elementary School | Houston Independent School District | Houston | 95.14% | |||
| Ketelsen Elementary School | Houston Independent School District | Houston | 95.30% | |||
| Looscan Elementary School | Houston Independent School District | Houston | 96.31% | |||
| Martinez Elementary School | Houston Independent School District | Houston | 98.46% | |||
| Sherman Elementary School | Houston Independent School District | Houston | 95.21% | |||
| Travis Elementary School | Houston Independent School District | Houston | 14.27% |