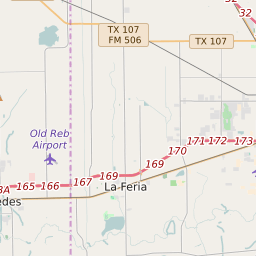
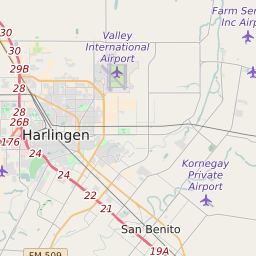
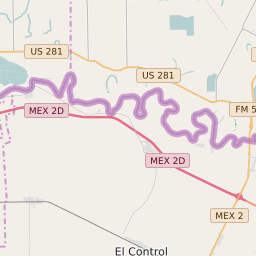
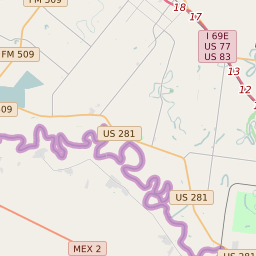
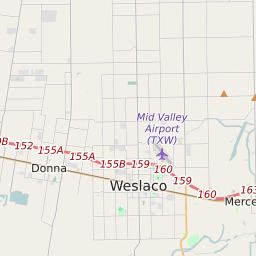
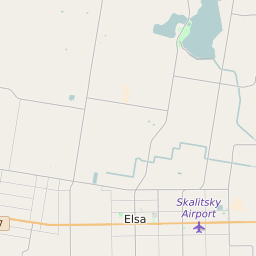
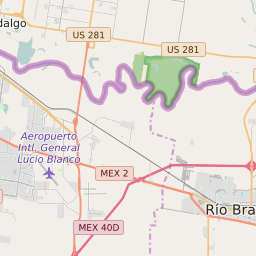
Map of ZIP Code 78550, Texas Elementary School Free and Reduced Lunch Program Participation
< 20% |
20 - 40% |
40 - 60% |
60 - 80% |
> 80% |
No Data |
Click on the map for more information about each school boundary. Add City/Town and County Boundaries to the map using the icon in the upper right corner of the map.
Change Map:
List of Elementary Schools in ZIP Code 78550 Texas
| Map Key | School Name | School District | City | Free/Reduced Lunch Program Participation | ||
|---|---|---|---|---|---|---|
| Austin Elementary School | Harlingen Consolidated Independent School District | Harlingen | 87.68% | |||
| Ben Milam Elementary School | Harlingen Consolidated Independent School District | Harlingen | 90.57% | |||
| Bonham Elementary School | Harlingen Consolidated Independent School District | Harlingen | 86.28% | |||
| Bowie Elementary School | Harlingen Consolidated Independent School District | Harlingen | 89.88% | |||
| Crockett Elementary School | Harlingen Consolidated Independent School District | Harlingen | 92.26% | |||
| Dishman Elementary School | Harlingen Consolidated Independent School District | Combes | 91.05% | |||
| Houston Elementary School | Harlingen Consolidated Independent School District | Harlingen | 87.16% | |||
| Jefferson Elementary School | Harlingen Consolidated Independent School District | Harlingen | 98.68% | |||
| Lamar Elementary School | Harlingen Consolidated Independent School District | Harlingen | 89.62% | |||
| Long Elementary School | Harlingen Consolidated Independent School District | Harlingen | 81.79% | |||
| Means Elementary School | Harlingen Consolidated Independent School District | Harlingen | 67.33% | |||
| Rio Hondo Elementary School | Rio Hondo Independent School District | Rio Hondo | 91.27% | |||
| Stuart Place Elementary School | Harlingen Consolidated Independent School District | Harlingen | 53.64% | |||
| Travis Elementary School | Harlingen Consolidated Independent School District | Harlingen | 89.17% | |||
| Treasure Hills Elementary School | Harlingen Consolidated Independent School District | Harlingen | 71.04% | |||
| Zavala Elementary School | Harlingen Consolidated Independent School District | Harlingen | 97.45% |