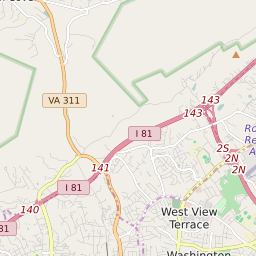
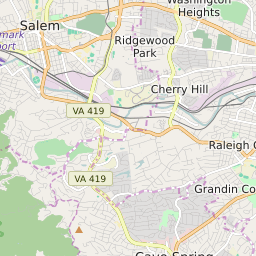
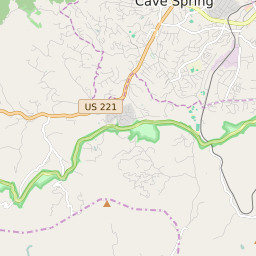
Map of Roanoke City Public Schools Elementary School Free and Reduced Lunch Program Participation
< 20% |
20 - 40% |
40 - 60% |
60 - 80% |
> 80% |
No Data |
Click on the map for more information about each school boundary. Add City/Town and County Boundaries to the map using the icon in the upper right corner of the map.
Change Map:
List of Elementary Schools in Roanoke City Public Schools Virginia
| Map Key | School Name | ZIP Code | City | Free/Reduced Lunch Program Participation | ||
|---|---|---|---|---|---|---|
| Crystal Spring Elementary School | 24014 | Roanoke | 24.60% | |||
| Fairview Elementary School | 24017 | Roanoke | 99.50% | |||
| Fallon Park Elementary School | 24013 | Roanoke | 99.50% | |||
| Fishburn Park Elementary School | 24015 | Roanoke | 99.00% | |||
| Garden City Elementary School | 24014 | Roanoke | 99.00% | |||
| Grandin Court Elementary School | 24015 | Roanoke | 35.60% | |||
| Highland Park Elementary School | 24016 | Roanoke | 98.10% | |||
| Hurt Park Elementary School | 24016 | Roanoke | 99.20% | |||
| Lincoln Terrace Elementary School | 24012 | Roanoke | 99.10% | |||
| Monterey Elementary School | 24012 | Roanoke | 99.40% | |||
| Morningside Elementary School | 24013 | Roanoke | 98.80% | |||
| Preston Park Elementary School | 24012 | Roanoke | 99.40% | |||
| Roanoke Academy For Math & Science Elementary School | 24017 | Roanoke | 99.30% | |||
| Round Hill Elementary School | 24012 | Roanoke | 99.60% | |||
| Virginia Heights Elementary School | 24015 | Roanoke | 99.10% | |||
| Wasena Elementary School | 24015 | Roanoke | 97.50% | |||
| Westside Elementary School | 24017 | Roanoke | 99.60% |


