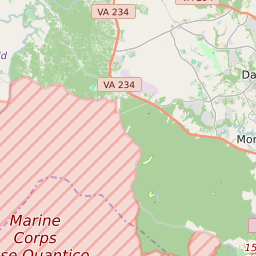
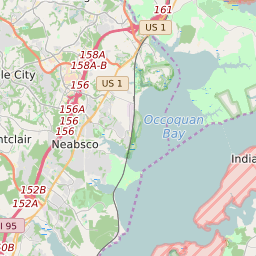
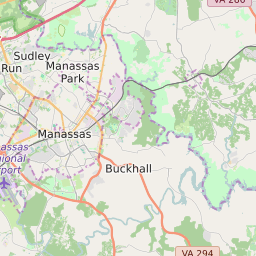
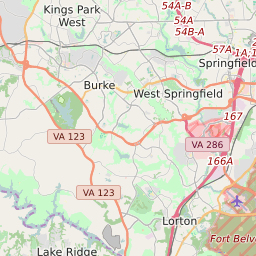
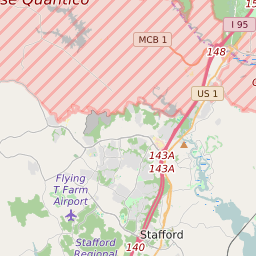
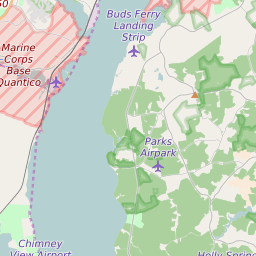
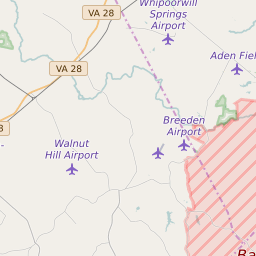
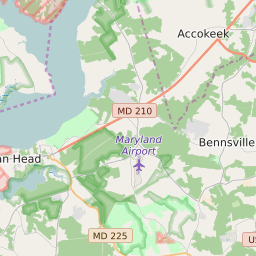
Map of ZIP Code 22191, Virginia Elementary School Free and Reduced Lunch Program Participation
< 20% |
20 - 40% |
40 - 60% |
60 - 80% |
> 80% |
No Data |
Click on the map for more information about each school boundary. Add City/Town and County Boundaries to the map using the icon in the upper right corner of the map.
Change Map:
List of Elementary Schools in ZIP Code 22191 Virginia
| Map Key | School Name | School District | City | Free/Reduced Lunch Program Participation | ||
|---|---|---|---|---|---|---|
| Belmont Elementary School | Prince William County Public Schools | Woodbridge | 71.70% | |||
| Featherstone Elementary School | Prince William County Public Schools | Woodbridge | 81.20% | |||
| Fitzgerald Elementary School | Prince William County Public Schools | Woodbridge | 56.00% | |||
| Kilby Elementary School | Prince William County Public Schools | Woodbridge | 83.20% | |||
| King Elementary School | Prince William County Public Schools | Woodbridge | 54.30% | |||
| Leesylvania Elementary School | Prince William County Public Schools | Woodbridge | 44.90% | |||
| Marumsco Hills Elementary School | Prince William County Public Schools | Woodbridge | 84.20% | |||
| Occoquan Elementary School | Prince William County Public Schools | Woodbridge | 59.70% | |||
| Potomac View Elementary School | Prince William County Public Schools | Woodbridge | 88.50% | |||
| River Oaks Elementary School | Prince William County Public Schools | Woodbridge | 63.90% | |||
| Vaughan Elementary School | Prince William County Public Schools | Woodbridge | 78.60% | |||
| Williams Elementary School | Prince William County Public Schools | Dumfries | 41.80% |