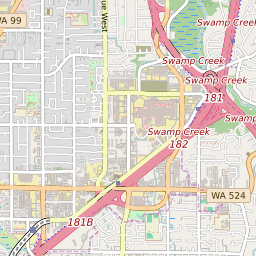
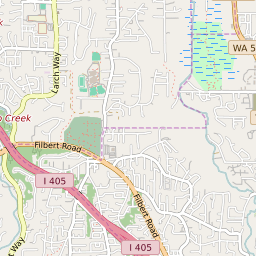
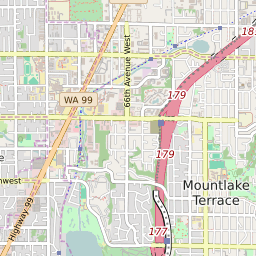
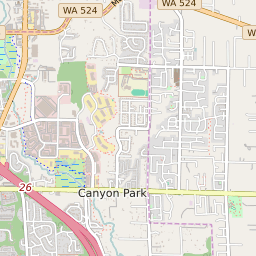
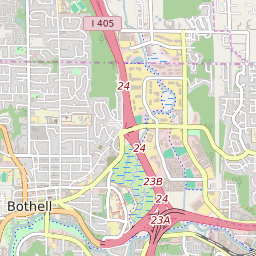
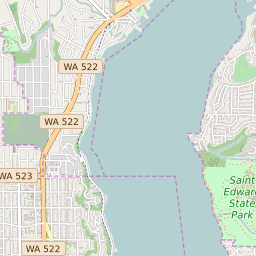
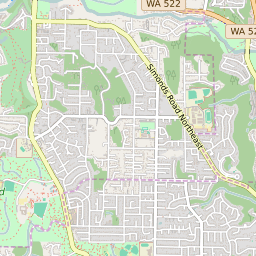
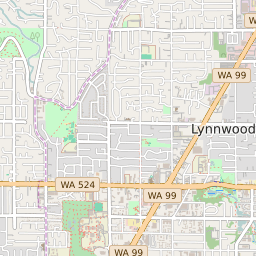
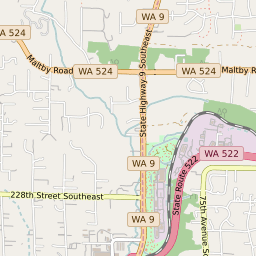
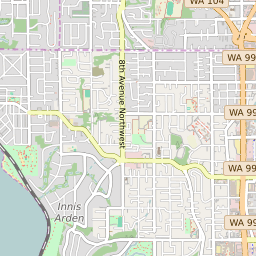
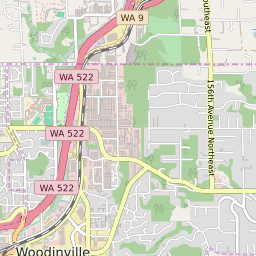
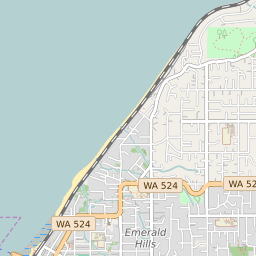
Map of ZIP Code 98021, Washington Elementary School Free and Reduced Lunch Program Participation
< 20% |
20 - 40% |
40 - 60% |
60 - 80% |
> 80% |
No Data |
Click on the map for more information about each school boundary. Add City/Town and County Boundaries to the map using the icon in the upper right corner of the map.

Change Map:
List of Elementary Schools in ZIP Code 98021 Washington
| Map Key | School Name | School District | City | Free/Reduced Lunch Program Participation | ||
|---|---|---|---|---|---|---|
| Canyon Creek Elementary School | Northshore School District | Bothell | 8.10% | |||
| Crystal Springs Elementary School | Northshore School District | Bothell | 20.83% | |||
| Frank Love Elementary School | Northshore School District | Bothell | 12.75% | |||
| Kenmore Elementary School | Northshore School District | Kenmore | 28.67% | |||
| Kokanee Elementary School | Northshore School District | Woodinville | 2.82% | |||
| Lockwood Elementary School | Northshore School District | Bothell | 5.15% | |||
| Maywood Hills Elementary School | Northshore School District | Bothell | 12.80% | |||
| Shelton View Elementary School | Northshore School District | Bothell | 15.61% |