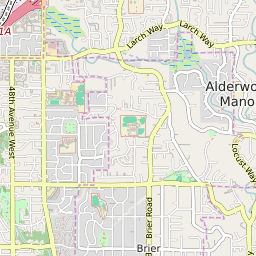
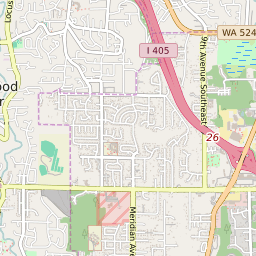
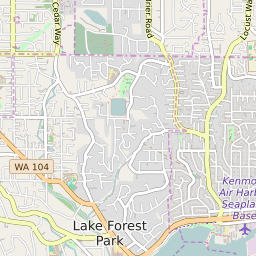
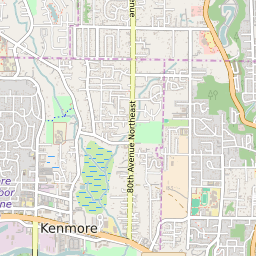
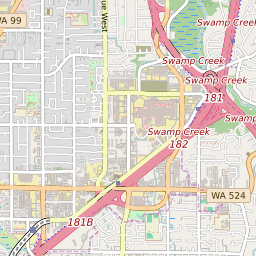
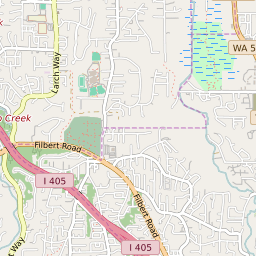
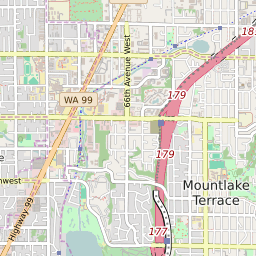
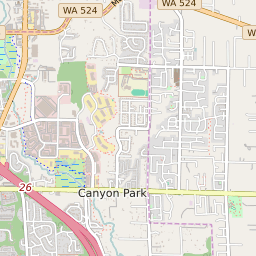
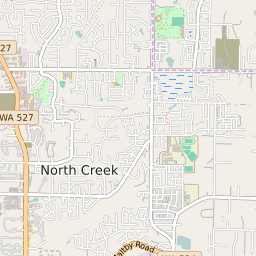
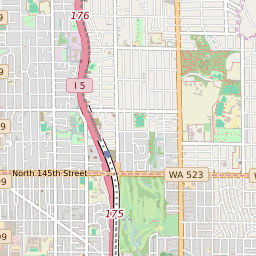
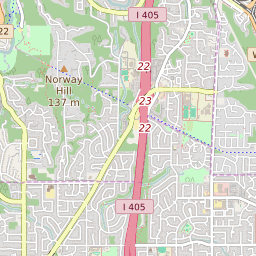
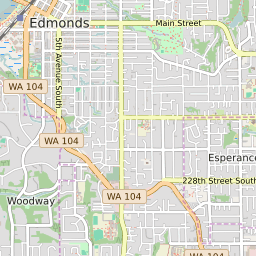
Map of ZIP Code 98021, Washington Elementary School Race and Ethnicity
White |
Black |
Asian |
Hispanic |
Native American |
Hawaiian/Pacific Islander |
No Data |
Click on the map for more information about each school boundary. Add City/Town and County Boundaries to the map using the icon in the upper right corner of the map.

Change Map:
List of Elementary Schools in ZIP Code 98021 Washington
| Map Key | School Name | School District | City | Majority Race/Ethnicity | ||
|---|---|---|---|---|---|---|
| Canyon Creek Elementary School | Northshore School District | Bothell | Asian: 43% | |||
| Crystal Springs Elementary School | Northshore School District | Bothell | White: 39% | |||
| Frank Love Elementary School | Northshore School District | Bothell | White: 51% | |||
| Kenmore Elementary School | Northshore School District | Kenmore | White: 47% | |||
| Kokanee Elementary School | Northshore School District | Woodinville | Asian: 64% | |||
| Lockwood Elementary School | Northshore School District | Bothell | White: 54% | |||
| Maywood Hills Elementary School | Northshore School District | Bothell | White: 58% | |||
| Shelton View Elementary School | Northshore School District | Bothell | White: 45% |