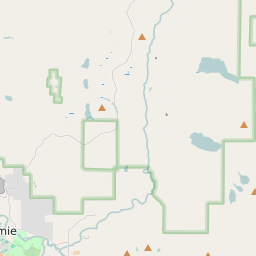
Map of ZIP Code 98030, Washington Elementary School Free and Reduced Lunch Program Participation
< 20% |
20 - 40% |
40 - 60% |
60 - 80% |
> 80% |
No Data |
Click on the map for more information about each school boundary. Add City/Town and County Boundaries to the map using the icon in the upper right corner of the map.

Change Map:
List of Elementary Schools in ZIP Code 98030 Washington
| Map Key | School Name | School District | City | Free/Reduced Lunch Program Participation | ||
|---|---|---|---|---|---|---|
| Daniel Elementary School | Kent School District | Kent | 77.73% | |||
| East Hill Elementary School | Kent School District | Kent | 76.08% | |||
| Emerald Park Elementary School | Kent School District | Kent | 49.35% | |||
| Glenridge Elementary School | Kent School District | Kent | 50.75% | |||
| Panther Lake Elementary School | Kent School District | Kent | 69.06% | |||
| Park Orchard Elementary School | Kent School District | Kent | 70.80% | |||
| Soos Creek Elementary School | Kent School District | Kent | 40.93% | |||
| Springbrook Elementary School | Kent School District | Kent | 70.68% | |||
| Star Lake Elementary School | Federal Way School District | Kent | 65.07% | |||
| Sunrise Elementary School | Northshore School District | Redmond | 2.38% |