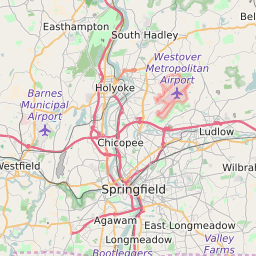
01020 can be classified socioeconomically as Lower Middle Class class compared to other ZIP Codes in Massachusetts based on Median Household Income and Average Adjusted Gross Income. The majority race/ethnicity residing in 01020 is White. The majority race/ethnicity attending public schools in 01020 is White. The current unemployment level in 01020 is 4.2%.
| Population | 30,417 |
| Population Growth Rate | 1.84% |
| Population Density | 2,391 People per Square Mile |
| Total Households | 12,922 |
| Percentage High Income Households | 1.3% |
| Median Household Income (2021) | $61,963 |
| Average Adjusted Gross Income (2021) | $313,900 |
| Current Unemployment Rate (February 2025) | 4.2% |
| Majority Race/Ethnicty | White - 78.05% |
| Public School Majority Race/Ethnicty | White - 49.68% |
01020 Race/Ethnicty Breakdown
| Race/Ethnicty | Total | Percentage |
|---|
| White | 25,560 | 78.05% |
| Black | 1,684 | 5.14% |
| Hispanic | 5,086 | 15.53% |
| Asian | 405 | 1.24% |
| Native American | 13 | 0.04% |
| Hawaiian/Pac. Islander | 0 | 0% |
01020 Public School Race/Ethnicty Breakdown
| Race/Ethnicty | Total | Percentage |
|---|
| White | 2,588 | 51.33% |
| Black | 232 | 4.6% |
| Hispanic | 2,106 | 41.77% |
| Asian | 109 | 2.16% |
| Native American | 3 | 0.06% |
| Hawaiian/Pac. Islander | 4 | 0.08% |
01020 Educational Attainment Levels
| Highest Education Level Attained | Total | Percentage |
|---|
| Less Than 1 Year of College | 1,839 | 9.47% |
| Bachelor Degree | 2,972 | 15.31% |
| High School Diploma | 6,643 | 34.21% |
| No High School Diploma | 528 | 2.72% |
| GED or Alternate | 1,285 | 6.62% |
| 1 or More Years of College | 2,597 | 13.38% |
| Associates Degree | 2,433 | 12.53% |
| Masters Degree | 967 | 4.98% |
| Professional Degree | 75 | 0.39% |
| Doctorate Degree | 77 | 0.4% |