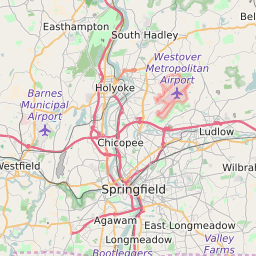
01109 can be classified socioeconomically as Lower Middle Class class compared to other ZIP Codes in Massachusetts based on Median Household Income and Average Adjusted Gross Income. The majority race/ethnicity residing in 01109 is White. The majority race/ethnicity attending public schools in 01109 is Hispanic. The current unemployment level in 01109 is 4.2%.
| Population | 31,301 |
| Population Growth Rate | 0.00% |
| Population Density | 6,171 People per Square Mile |
| Total Households | 9,553 |
| Percentage High Income Households | 0.9% |
| Median Household Income (2021) | $37,887 |
| Average Adjusted Gross Income (2021) | $408,740 |
| Current Unemployment Rate (February 2025) | 4.2% |
| Majority Race/Ethnicty | White - 34.61% |
| Public School Majority Race/Ethnicty | Hispanic - 66.01% |
01109 Race/Ethnicty Breakdown
| Race/Ethnicty | Total | Percentage |
|---|
| White | 13,349 | 34.6% |
| Black | 11,059 | 28.66% |
| Hispanic | 13,314 | 34.51% |
| Asian | 533 | 1.38% |
| Native American | 315 | 0.82% |
| Hawaiian/Pac. Islander | 13 | 0.03% |
01109 Public School Race/Ethnicty Breakdown
| Race/Ethnicty | Total | Percentage |
|---|
| White | 734 | 8.84% |
| Black | 1,773 | 21.36% |
| Hispanic | 5,577 | 67.18% |
| Asian | 203 | 2.45% |
| Native American | 12 | 0.14% |
| Hawaiian/Pac. Islander | 2 | 0.02% |
01109 Educational Attainment Levels
| Highest Education Level Attained | Total | Percentage |
|---|
| Less Than 1 Year of College | 961 | 7.53% |
| Bachelor Degree | 1,424 | 11.15% |
| High School Diploma | 4,813 | 37.69% |
| No High School Diploma | 494 | 3.87% |
| GED or Alternate | 1,097 | 8.59% |
| 1 or More Years of College | 2,357 | 18.46% |
| Associates Degree | 981 | 7.68% |
| Masters Degree | 488 | 3.82% |
| Professional Degree | 115 | 0.9% |
| Doctorate Degree | 40 | 0.31% |