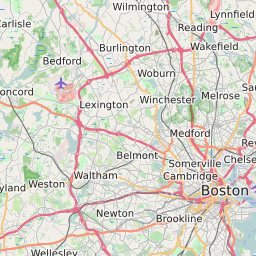
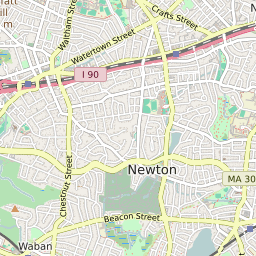
02465 can be classified socioeconomically as Upper Middle Class class compared to other ZIP Codes in Massachusetts based on Median Household Income and Average Adjusted Gross Income. The majority race/ethnicity residing in 02465 is White. The majority race/ethnicity attending public schools in 02465 is White. The current unemployment level in 02465 is 4.2%.
| Population | 11,823 |
| Population Growth Rate | -4.44% |
| Population Density | 5,485 People per Square Mile |
| Total Households | 4,300 |
| Percentage High Income Households | 27.4% |
| Median Household Income (2021) | $167,330 |
| Average Adjusted Gross Income (2021) | $1,770,930 |
| Current Unemployment Rate (February 2025) | 4.2% |
| Majority Race/Ethnicty | White - 77.10% |
| Public School Majority Race/Ethnicty | White - 63.21% |
02465 Race/Ethnicty Breakdown
| Race/Ethnicty | Total | Percentage |
|---|
| White | 8,416 | 77.1% |
| Black | 243 | 2.23% |
| Hispanic | 569 | 5.21% |
| Asian | 1,679 | 15.38% |
| Native American | 8 | 0.07% |
| Hawaiian/Pac. Islander | 0 | 0% |
02465 Public School Race/Ethnicty Breakdown
| Race/Ethnicty | Total | Percentage |
|---|
| White | 390 | 68.54% |
| Black | 15 | 2.64% |
| Hispanic | 54 | 9.49% |
| Asian | 109 | 19.16% |
| Native American | 0 | 0% |
| Hawaiian/Pac. Islander | 1 | 0.18% |
02465 Educational Attainment Levels
| Highest Education Level Attained | Total | Percentage |
|---|
| Less Than 1 Year of College | 158 | 1.96% |
| Bachelor Degree | 2,331 | 28.95% |
| High School Diploma | 1,114 | 13.84% |
| No High School Diploma | 93 | 1.16% |
| GED or Alternate | 70 | 0.87% |
| 1 or More Years of College | 527 | 6.55% |
| Associates Degree | 244 | 3.03% |
| Masters Degree | 2,156 | 26.78% |
| Professional Degree | 804 | 9.99% |
| Doctorate Degree | 554 | 6.88% |