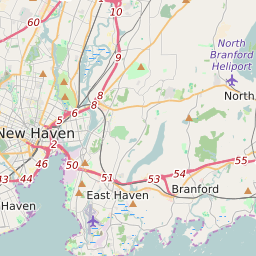
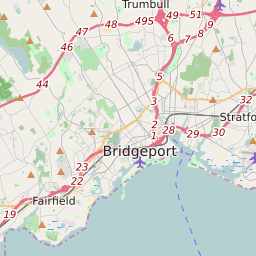
06516 can be classified socioeconomically as Lower Middle Class class compared to other ZIP Codes in Connecticut based on Median Household Income and Average Adjusted Gross Income. The majority race/ethnicity residing in 06516 is White. The majority race/ethnicity attending public schools in 06516 is Hispanic. The current unemployment level in 06516 is 2.7%.
| Population | 55,336 |
| Population Growth Rate | 0.00% |
| Population Density | 4,916 People per Square Mile |
| Total Households | 21,878 |
| Percentage High Income Households | 2.8% |
| Median Household Income (2021) | $66,868 |
| Average Adjusted Gross Income (2021) | $348,000 |
| Current Unemployment Rate (February 2025) | 2.7% |
| Majority Race/Ethnicty | White - 53.16% |
| Public School Majority Race/Ethnicty | Hispanic - 37.38% |
06516 Race/Ethnicty Breakdown
| Race/Ethnicty | Total | Percentage |
|---|
| White | 31,653 | 52.99% |
| Black | 10,819 | 18.11% |
| Hispanic | 14,032 | 23.49% |
| Asian | 2,819 | 4.72% |
| Native American | 219 | 0.37% |
| Hawaiian/Pac. Islander | 196 | 0.33% |
06516 Public School Race/Ethnicty Breakdown
| Race/Ethnicty | Total | Percentage |
|---|
| White | 1,774 | 30.1% |
| Black | 1,523 | 25.84% |
| Hispanic | 2,308 | 39.16% |
| Asian | 278 | 4.72% |
| Native American | 10 | 0.17% |
| Hawaiian/Pac. Islander | 1 | 0.02% |
06516 Educational Attainment Levels
| Highest Education Level Attained | Total | Percentage |
|---|
| Less Than 1 Year of College | 2,035 | 6.07% |
| Bachelor Degree | 4,779 | 14.25% |
| High School Diploma | 12,301 | 36.68% |
| No High School Diploma | 701 | 2.09% |
| GED or Alternate | 1,761 | 5.25% |
| 1 or More Years of College | 5,957 | 17.76% |
| Associates Degree | 2,749 | 8.2% |
| Masters Degree | 2,371 | 7.07% |
| Professional Degree | 644 | 1.92% |
| Doctorate Degree | 237 | 0.71% |