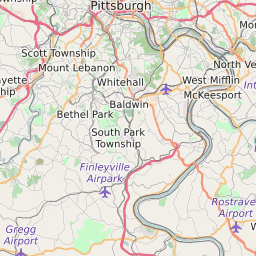
15110 can be classified socioeconomically as Lower Middle Class class compared to other ZIP Codes in Pennsylvania based on Median Household Income and Average Adjusted Gross Income. The majority race/ethnicity residing in 15110 is African American. The majority race/ethnicity attending public schools in 15110 is African American. The current unemployment level in 15110 is 3.3%.
| Population | 5,241 |
| Population Growth Rate | -4.76% |
| Population Density | 2,384 People per Square Mile |
| Total Households | 2,559 |
| Median Household Income (2021) | $37,478 |
| Average Adjusted Gross Income (2021) | $140,230 |
| Current Unemployment Rate (February 2025) | 3.3% |
| Majority Race/Ethnicty | African American - 56.46% |
| Public School Majority Race/Ethnicty | African American - 66.67% |
15110 Race/Ethnicty Breakdown
| Race/Ethnicty | Total | Percentage |
|---|
| White | 1,882 | 41.57% |
| Black | 2,556 | 56.46% |
| Hispanic | 87 | 1.92% |
| Asian | 0 | 0% |
| Native American | 2 | 0.04% |
| Hawaiian/Pac. Islander | 0 | 0% |
15110 Public School Race/Ethnicty Breakdown
| Race/Ethnicty | Total | Percentage |
|---|
| White | 30 | 9.58% |
| Black | 238 | 76.04% |
| Hispanic | 15 | 4.79% |
| Asian | 28 | 8.95% |
| Native American | 2 | 0.64% |
| Hawaiian/Pac. Islander | 0 | 0% |
15110 Educational Attainment Levels
| Highest Education Level Attained | Total | Percentage |
|---|
| Less Than 1 Year of College | 319 | 9.73% |
| Bachelor Degree | 189 | 5.77% |
| High School Diploma | 1,532 | 46.75% |
| No High School Diploma | 41 | 1.25% |
| GED or Alternate | 198 | 6.04% |
| 1 or More Years of College | 464 | 14.16% |
| Associates Degree | 389 | 11.87% |
| Masters Degree | 90 | 2.75% |
| Professional Degree | 33 | 1.01% |
| Doctorate Degree | 22 | 0.67% |