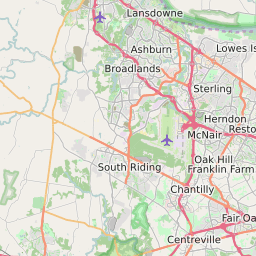
20194 can be classified socioeconomically as Middle Class class compared to other ZIP Codes in Virginia based on Median Household Income and Average Adjusted Gross Income. The majority race/ethnicity residing in 20194 is White. The majority race/ethnicity attending public schools in 20194 is White. The current unemployment level in 20194 is 2.5%.
| Population | 12,576 |
| Population Growth Rate | -2.98% |
| Population Density | 4,000 People per Square Mile |
| Total Households | 5,829 |
| Percentage High Income Households | 29.9% |
| Median Household Income (2021) | $143,301 |
| Average Adjusted Gross Income (2021) | $496,570 |
| Current Unemployment Rate (February 2025) | 2.5% |
| Majority Race/Ethnicty | White - 75.18% |
| Public School Majority Race/Ethnicty | White - 53.66% |
20194 Race/Ethnicty Breakdown
| Race/Ethnicty | Total | Percentage |
|---|
| White | 9,061 | 75.18% |
| Black | 515 | 4.27% |
| Hispanic | 1,094 | 9.08% |
| Asian | 1,383 | 11.47% |
| Native American | 0 | 0% |
| Hawaiian/Pac. Islander | 0 | 0% |
20194 Public School Race/Ethnicty Breakdown
| Race/Ethnicty | Total | Percentage |
|---|
| White | 491 | 58.52% |
| Black | 56 | 6.67% |
| Hispanic | 130 | 15.49% |
| Asian | 160 | 19.07% |
| Native American | 2 | 0.24% |
| Hawaiian/Pac. Islander | 0 | 0% |
20194 Educational Attainment Levels
| Highest Education Level Attained | Total | Percentage |
|---|
| Less Than 1 Year of College | 370 | 4% |
| Bachelor Degree | 3,656 | 39.48% |
| High School Diploma | 582 | 6.28% |
| No High School Diploma | 0 | 0% |
| GED or Alternate | 48 | 0.52% |
| 1 or More Years of College | 865 | 9.34% |
| Associates Degree | 390 | 4.21% |
| Masters Degree | 2,386 | 25.76% |
| Professional Degree | 498 | 5.38% |
| Doctorate Degree | 466 | 5.03% |