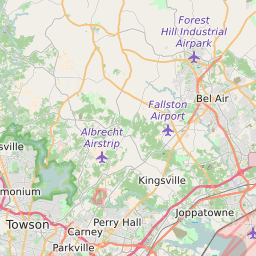
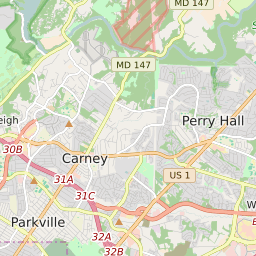
21162 can be classified socioeconomically as Middle Class class compared to other ZIP Codes in Maryland based on Median Household Income and Average Adjusted Gross Income. The majority race/ethnicity residing in 21162 is White. The majority race/ethnicity attending public schools in 21162 is African American. The current unemployment level in 21162 is 2.7%.
| Population | 4,322 |
| Population Growth Rate | 13.25% |
| Population Density | 452 People per Square Mile |
| Total Households | 1,171 |
| Percentage High Income Households | 8.0% |
| Median Household Income (2021) | $139,028 |
| Average Adjusted Gross Income (2021) | $347,030 |
| Current Unemployment Rate (February 2025) | 2.7% |
| Majority Race/Ethnicty | White - 78.24% |
| Public School Majority Race/Ethnicty | African American - 44.47% |
21162 Race/Ethnicty Breakdown
| Race/Ethnicty | Total | Percentage |
|---|
| White | 3,588 | 78.24% |
| Black | 702 | 15.31% |
| Hispanic | 214 | 4.67% |
| Asian | 82 | 1.79% |
| Native American | 0 | 0% |
| Hawaiian/Pac. Islander | 0 | 0% |
21162 Public School Race/Ethnicty Breakdown
| Race/Ethnicty | Total | Percentage |
|---|
| White | 253 | 36.09% |
| Black | 330 | 47.08% |
| Hispanic | 50 | 7.13% |
| Asian | 66 | 9.42% |
| Native American | 1 | 0.14% |
| Hawaiian/Pac. Islander | 1 | 0.14% |
21162 Educational Attainment Levels
| Highest Education Level Attained | Total | Percentage |
|---|
| Less Than 1 Year of College | 241 | 11.36% |
| Bachelor Degree | 355 | 16.73% |
| High School Diploma | 575 | 27.1% |
| No High School Diploma | 22 | 1.04% |
| GED or Alternate | 135 | 6.36% |
| 1 or More Years of College | 458 | 21.58% |
| Associates Degree | 168 | 7.92% |
| Masters Degree | 108 | 5.09% |
| Professional Degree | 36 | 1.7% |
| Doctorate Degree | 24 | 1.13% |