22520 can be classified socioeconomically as Lower Middle Class class compared to other ZIP Codes in Virginia based on Median Household Income and Average Adjusted Gross Income. The majority race/ethnicity residing in 22520 is White. The majority race/ethnicity attending public schools in 22520 is African American. The current unemployment level in 22520 is 3.0%.
| Population | 4,673 |
| Population Growth Rate | 0.00% |
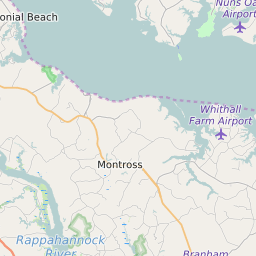
| Population Density | 43 People per Square Mile |
| Total Households | 2,230 |
| Percentage High Income Households | 2.1% |
| Median Household Income (2021) | $51,641 |
| Average Adjusted Gross Income (2021) | $335,180 |
| Current Unemployment Rate (January 2025) | 3.0% |
| Majority Race/Ethnicty | White - 61.18% |
| Public School Majority Race/Ethnicty | African American - 39.61% |
22520 Race/Ethnicty Breakdown
| Race/Ethnicty | Total | Percentage |
|---|
| White | 2,574 | 61.17% |
| Black | 1,521 | 36.15% |
| Hispanic | 88 | 2.09% |
| Asian | 24 | 0.57% |
| Native American | 0 | 0% |
| Hawaiian/Pac. Islander | 1 | 0.02% |
22520 Public School Race/Ethnicty Breakdown
| Race/Ethnicty | Total | Percentage |
|---|
| White | 304 | 39.43% |
| Black | 326 | 42.28% |
| Hispanic | 136 | 17.64% |
| Asian | 2 | 0.26% |
| Native American | 1 | 0.13% |
| Hawaiian/Pac. Islander | 2 | 0.26% |
22520 Educational Attainment Levels
| Highest Education Level Attained | Total | Percentage |
|---|
| Less Than 1 Year of College | 269 | 9.17% |
| Bachelor Degree | 379 | 12.92% |
| High School Diploma | 859 | 29.29% |
| No High School Diploma | 39 | 1.33% |
| GED or Alternate | 136 | 4.64% |
| 1 or More Years of College | 609 | 20.76% |
| Associates Degree | 234 | 7.98% |
| Masters Degree | 223 | 7.6% |
| Professional Degree | 175 | 5.97% |
| Doctorate Degree | 10 | 0.34% |