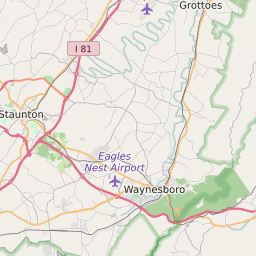
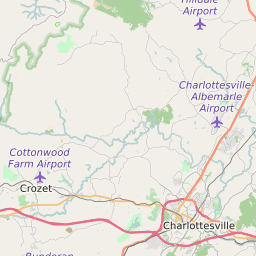
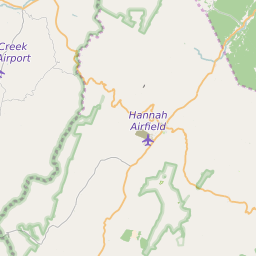
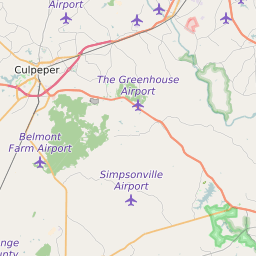
22932 can be classified socioeconomically as Middle Class class compared to other ZIP Codes in Virginia based on Median Household Income and Average Adjusted Gross Income. The majority race/ethnicity residing in 22932 is White. The majority race/ethnicity attending public schools in 22932 is White. The current unemployment level in 22932 is 2.5%.
| Population | 8,495 |
| Population Growth Rate | -4.83% |
| Population Density | 84 People per Square Mile |
| Total Households | 2,727 |
| Percentage High Income Households | 4.3% |
| Median Household Income (2021) | $102,344 |
| Average Adjusted Gross Income (2021) | $543,730 |
| Current Unemployment Rate (February 2025) | 2.5% |
| Majority Race/Ethnicty | White - 93.43% |
| Public School Majority Race/Ethnicty | White - 84.44% |
22932 Race/Ethnicty Breakdown
| Race/Ethnicty | Total | Percentage |
|---|
| White | 6,995 | 93.43% |
| Black | 97 | 1.3% |
| Hispanic | 123 | 1.64% |
| Asian | 171 | 2.28% |
| Native American | 101 | 1.35% |
| Hawaiian/Pac. Islander | 0 | 0% |
22932 Public School Race/Ethnicty Breakdown
| Race/Ethnicty | Total | Percentage |
|---|
| White | 2,599 | 87.86% |
| Black | 63 | 2.13% |
| Hispanic | 167 | 5.65% |
| Asian | 120 | 4.06% |
| Native American | 5 | 0.17% |
| Hawaiian/Pac. Islander | 4 | 0.14% |
22932 Educational Attainment Levels
| Highest Education Level Attained | Total | Percentage |
|---|
| Less Than 1 Year of College | 210 | 4.51% |
| Bachelor Degree | 1,110 | 23.85% |
| High School Diploma | 1,418 | 30.46% |
| No High School Diploma | 49 | 1.05% |
| GED or Alternate | 83 | 1.78% |
| 1 or More Years of College | 519 | 11.15% |
| Associates Degree | 255 | 5.48% |
| Masters Degree | 714 | 15.34% |
| Professional Degree | 137 | 2.94% |
| Doctorate Degree | 160 | 3.44% |