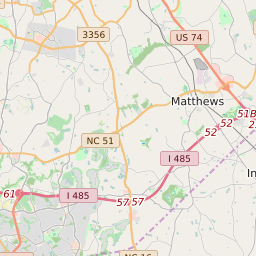
28105 can be classified socioeconomically as Middle Class class compared to other ZIP Codes in North Carolina based on Median Household Income and Average Adjusted Gross Income. The majority race/ethnicity residing in 28105 is White. The majority race/ethnicity attending public schools in 28105 is White. The current unemployment level in 28105 is 3.4%.
| Population | 44,899 |
| Population Growth Rate | -2.21% |
| Population Density | 1,892 People per Square Mile |
| Total Households | 14,900 |
| Percentage High Income Households | 6.1% |
| Median Household Income (2021) | $92,479 |
| Average Adjusted Gross Income (2021) | $434,220 |
| Current Unemployment Rate (February 2025) | 3.4% |
| Majority Race/Ethnicty | White - 70.41% |
| Public School Majority Race/Ethnicty | White - 44.99% |
28105 Race/Ethnicty Breakdown
| Race/Ethnicty | Total | Percentage |
|---|
| White | 31,911 | 70.41% |
| Black | 5,476 | 12.08% |
| Hispanic | 4,418 | 9.75% |
| Asian | 3,305 | 7.29% |
| Native American | 212 | 0.47% |
| Hawaiian/Pac. Islander | 0 | 0% |
28105 Public School Race/Ethnicty Breakdown
| Race/Ethnicty | Total | Percentage |
|---|
| White | 3,294 | 46.65% |
| Black | 1,621 | 22.96% |
| Hispanic | 1,457 | 20.63% |
| Asian | 665 | 9.42% |
| Native American | 12 | 0.17% |
| Hawaiian/Pac. Islander | 12 | 0.17% |
28105 Educational Attainment Levels
| Highest Education Level Attained | Total | Percentage |
|---|
| Less Than 1 Year of College | 1,556 | 6.21% |
| Bachelor Degree | 7,870 | 31.43% |
| High School Diploma | 4,188 | 16.73% |
| No High School Diploma | 378 | 1.51% |
| GED or Alternate | 511 | 2.04% |
| 1 or More Years of College | 4,341 | 17.34% |
| Associates Degree | 2,497 | 9.97% |
| Masters Degree | 2,674 | 10.68% |
| Professional Degree | 732 | 2.92% |
| Doctorate Degree | 292 | 1.17% |