30222 can be classified socioeconomically as Lower Middle Class class compared to other ZIP Codes in Georgia based on Median Household Income and Average Adjusted Gross Income. The majority race/ethnicity residing in 30222 is African American. The majority race/ethnicity attending public schools in 30222 is African American. The current unemployment level in 30222 is 3.4%.
| Population | 4,982 |
| Population Growth Rate | 0.00% |
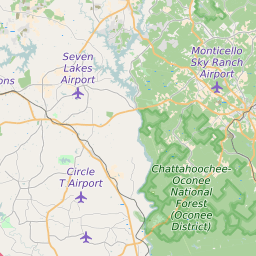
| Population Density | 31 People per Square Mile |
| Total Households | 1,614 |
| Percentage High Income Households | 0.7% |
| Median Household Income (2021) | $51,823 |
| Average Adjusted Gross Income (2021) | $1,309,450 |
| Current Unemployment Rate (February 2025) | 3.4% |
| Majority Race/Ethnicty | African American - 49.98% |
| Public School Majority Race/Ethnicty | African American - 70.86% |
30222 Race/Ethnicty Breakdown
| Race/Ethnicty | Total | Percentage |
|---|
| White | 2,503 | 48% |
| Black | 2,601 | 49.88% |
| Hispanic | 100 | 1.92% |
| Asian | 0 | 0% |
| Native American | 0 | 0% |
| Hawaiian/Pac. Islander | 11 | 0.21% |
30222 Public School Race/Ethnicty Breakdown
| Race/Ethnicty | Total | Percentage |
|---|
| White | 88 | 21.26% |
| Black | 304 | 73.43% |
| Hispanic | 20 | 4.83% |
| Asian | 2 | 0.48% |
| Native American | 0 | 0% |
| Hawaiian/Pac. Islander | 0 | 0% |
30222 Educational Attainment Levels
| Highest Education Level Attained | Total | Percentage |
|---|
| Less Than 1 Year of College | 229 | 10.33% |
| Bachelor Degree | 211 | 9.52% |
| High School Diploma | 923 | 41.63% |
| No High School Diploma | 86 | 3.88% |
| GED or Alternate | 116 | 5.23% |
| 1 or More Years of College | 444 | 20.03% |
| Associates Degree | 107 | 4.83% |
| Masters Degree | 81 | 3.65% |
| Professional Degree | 3 | 0.14% |
| Doctorate Degree | 17 | 0.77% |