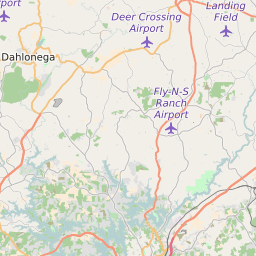
30543 can be classified socioeconomically as Lower Middle Class class compared to other ZIP Codes in Georgia based on Median Household Income and Average Adjusted Gross Income. The majority race/ethnicity residing in 30543 is White. The current unemployment level in 30543 is 3.4%.
| Population | 5,561 |
| Population Growth Rate | 0.00% |
| Population Density | 147 People per Square Mile |
| Total Households | 1,373 |
| Percentage High Income Households | 0.2% |
| Median Household Income (2021) | $69,262 |
| Average Adjusted Gross Income (2021) | $424,920 |
| Current Unemployment Rate (February 2025) | 3.4% |
| Majority Race/Ethnicty | White - 63.36% |
30543 Race/Ethnicty Breakdown
| Race/Ethnicty | Total | Percentage |
|---|
| White | 4,322 | 63.36% |
| Black | 153 | 2.24% |
| Hispanic | 2,338 | 34.28% |
| Asian | 0 | 0% |
| Native American | 8 | 0.12% |
| Hawaiian/Pac. Islander | 0 | 0% |
30543 Educational Attainment Levels
| Highest Education Level Attained | Total | Percentage |
|---|
| Less Than 1 Year of College | 178 | 8.9% |
| Bachelor Degree | 213 | 10.64% |
| High School Diploma | 669 | 33.43% |
| No High School Diploma | 73 | 3.65% |
| GED or Alternate | 237 | 11.84% |
| 1 or More Years of College | 402 | 20.09% |
| Associates Degree | 120 | 6% |
| Masters Degree | 48 | 2.4% |
| Professional Degree | 40 | 2% |
| Doctorate Degree | 21 | 1.05% |