31070 can be classified socioeconomically as Middle Class class compared to other ZIP Codes in Georgia based on Median Household Income and Average Adjusted Gross Income. The majority race/ethnicity residing in 31070 is White. The majority race/ethnicity attending public schools in 31070 is African American. The current unemployment level in 31070 is 3.4%.
| Population | 868 |
| Population Growth Rate | 0.00% |
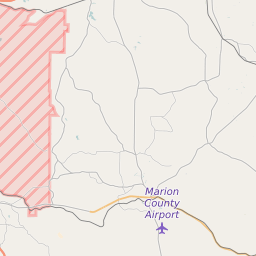
| Population Density | 16 People per Square Mile |
| Total Households | 544 |
| Median Household Income (2021) | $76,875 |
| Average Adjusted Gross Income (2021) | $200,930 |
| Current Unemployment Rate (February 2025) | 3.4% |
| Majority Race/Ethnicty | White - 57.20% |
| Public School Majority Race/Ethnicty | African American - 67.95% |
31070 Race/Ethnicty Breakdown
| Race/Ethnicty | Total | Percentage |
|---|
| White | 608 | 57.2% |
| Black | 402 | 37.82% |
| Hispanic | 53 | 4.99% |
| Asian | 0 | 0% |
| Native American | 0 | 0% |
| Hawaiian/Pac. Islander | 0 | 0% |
31070 Public School Race/Ethnicty Breakdown
| Race/Ethnicty | Total | Percentage |
|---|
| White | 73 | 8.99% |
| Black | 564 | 69.46% |
| Hispanic | 171 | 21.06% |
| Asian | 3 | 0.37% |
| Native American | 1 | 0.12% |
| Hawaiian/Pac. Islander | 0 | 0% |
31070 Educational Attainment Levels
| Highest Education Level Attained | Total | Percentage |
|---|
| Less Than 1 Year of College | 14 | 1.56% |
| Bachelor Degree | 103 | 11.44% |
| High School Diploma | 474 | 52.67% |
| No High School Diploma | 22 | 2.44% |
| GED or Alternate | 69 | 7.67% |
| 1 or More Years of College | 151 | 16.78% |
| Associates Degree | 56 | 6.22% |
| Masters Degree | 11 | 1.22% |
| Professional Degree | 0 | 0% |
| Doctorate Degree | 0 | 0% |