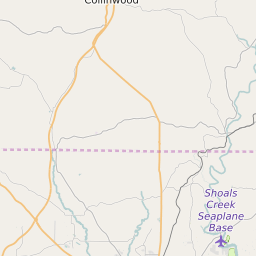
35613 can be classified socioeconomically as Middle Class class compared to other ZIP Codes in Alabama based on Median Household Income and Average Adjusted Gross Income. The majority race/ethnicity residing in 35613 is White. The majority race/ethnicity attending public schools in 35613 is White. The current unemployment level in 35613 is 3.2%.
| Population | 22,278 |
| Population Growth Rate | 0.00% |
| Population Density | 299 People per Square Mile |
| Total Households | 6,487 |
| Percentage High Income Households | 5.3% |
| Median Household Income (2021) | $84,512 |
| Average Adjusted Gross Income (2021) | $390,630 |
| Current Unemployment Rate (February 2025) | 3.2% |
| Majority Race/Ethnicty | White - 86.49% |
| Public School Majority Race/Ethnicty | White - 74.63% |
35613 Race/Ethnicty Breakdown
| Race/Ethnicty | Total | Percentage |
|---|
| White | 17,703 | 86.42% |
| Black | 1,059 | 5.17% |
| Hispanic | 1,402 | 6.84% |
| Asian | 241 | 1.18% |
| Native American | 63 | 0.31% |
| Hawaiian/Pac. Islander | 16 | 0.08% |
35613 Public School Race/Ethnicty Breakdown
| Race/Ethnicty | Total | Percentage |
|---|
| White | 1,112 | 75.96% |
| Black | 220 | 15.03% |
| Hispanic | 98 | 6.69% |
| Asian | 15 | 1.02% |
| Native American | 15 | 1.02% |
| Hawaiian/Pac. Islander | 4 | 0.27% |
35613 Educational Attainment Levels
| Highest Education Level Attained | Total | Percentage |
|---|
| Less Than 1 Year of College | 1,121 | 8.76% |
| Bachelor Degree | 2,496 | 19.51% |
| High School Diploma | 2,868 | 22.42% |
| No High School Diploma | 132 | 1.03% |
| GED or Alternate | 1,222 | 9.55% |
| 1 or More Years of College | 2,359 | 18.44% |
| Associates Degree | 1,251 | 9.78% |
| Masters Degree | 1,095 | 8.56% |
| Professional Degree | 85 | 0.66% |
| Doctorate Degree | 166 | 1.3% |